Russian and World Market for Turkey Meat
- Дата выхода отчёта: 15 октября 2012 г.
- География исследования: Россия
- Период исследования: актуализация по запросу
- Язык отчёта: Английский
- Способ предоставления: электронный
-
Описание
-
Содержание
Countries covered: Russia and Global Market
Russian and World Turkey Meat Market Research Report, produced by GLOBAL REACH CONSULTING, covers the following issues:
WORLD TURKEY MEAT MARKET
• World turkey meat production;
• World turkey meat and day-old turkey poults imports;
• World turkey meat and day-old turkey poults exports;
• 2012 Outlook for the global turkey meat market;
TURKEYS POPULATION IN RUSSIA
DOMESTIC TURKEY MEAT PRODUCTION
• Production volume;
• Production structure by type of farm;
• Largest producers;
TURKEY MEAT IMPORTS
• Volume and value of imports;
• Import prices;
• Geographical distribution of imports;
• Major foreign producers and importers in Russia;
• Key products:
Turkey hatching eggs;
Day-old turkey poults;
Fresh, chilled and frozen turkey carcasses;
Fresh, chilled and frozen cuts and edible offal of turkey.
RUSSIAN TURKEY MEAT MARKET BALANCE
• Market volume;
• Share of imports;
• Key market trends and forecast.
1. EXECUTIVE SUMMARY
1.1. Key Research Areas
1.2. Methodology
1.3. Management Summary
2. DEFINITIONS
2.1. Subject Definition
2.2. Main Turkey Breeds
2.3. Turkey Meat
2.4. Turkey Farming Industry
2.5. Carcass Yield of Turkeys
3. RUSSIAN ECONOMY DEVELOPMENT AND FORECAST FOR 2011-2015
3.1. GDP
3.2. Industrial Production Index
3.3. Foreign Trade
3.3. Forecast of Economy Development for 2012-2015
4. WORLD TURKEY MEAT MARKET
4.1 World Turkey Meat Production
4.2 World Imports of Turkey Poults
4.2.1 Imports Dynamics
4.2.2 Geographical Distribution of Imports
4.3 World Imports of Turkey Meat
4.3.1 Total Imports Dynamics
4.3.2 Imports of Frozen Turkey Cuts
4.3.3 Imports of Fresh or Chilled Turkey Cuts
4.3.4 Imports of Frozen Whole Turkey
4.3.5 Imports of Fresh or Chilled Whole Turkey
4.4 World Exports of Turkey Poults
4.4.1 Exports Dynamics
4.4.2 Geographical Distribution of Exports
4.5 World Exports of Turkey Meat
4.5.1 Total Exports Dynamics
4.5.2 Exports of Frozen Turkey Cuts
4.5.3 Exports of Fresh or Chilled Turkey Cuts
4.5.4 Exports of Frozen Whole Turkey
4.5.5 Exports of Fresh or Chilled Whole Turkey
4.6 World Turkey Meat Market
4.6.1 Market Volume
Geography of Consumption
4.7 2012 Outlook for the Global Turkey Meat Market
5. TURKEYS POPULATION IN RUSSIA
5.1 Geographical Distribution by Federal District
5.2 Geographical Distribution by Region
6. TURKEY MEAT PRODUCTION IN RUSSIA
6.1 Dynamics of Production Volume
6.2 Structure of Production
6.3 Largest Producers
6.3.1 EURODON LTD
6.3.2 KRASNOBOR CJSC
6.3.3 EGORYEVSKAYA TURKEY FARM LTD
6.3.4 BASHKIR POULTRY COMPLEX NAMED AFTER M. GAFURY LTD
6.3.5 ZADONSKAYA POULTRY FACTORY CJSC
6.4 Challenges of Russian Turkey Meat Production
7. TURKEY MEAT IMPORTS
7.1 Customs Duties
7.2 Imports of Turkey Hatching Egg
7.2.1 Imports by Country of Origin
7.2.2 Imports by Producing Company
7.2.3 Imports by Importing Company
7.2.4 Prices for Imported Turkey Hatching Eggs
7.3 Imports of Turkey Poults
7.3.1 Imports by Country of Origin
7.3.2 Imports by Importing Company
7.3.3 Prices for Imported Turkey Poults
7.4 Total Imports of Turkey Meat
7.4.1 Imports Volume and Value
7.4.2 Imports Structure by HS Codes
7.4.3 Imports by Country of Origin
7.5 Imports of Frozen Turkey Cuts
7.6 Imports of Fresh of Chilled Turkey Cuts
7.7 Imports of Frozen Whole Turkey
7.8 Turkey Meat Importers
7.9 Prices for Imported Turkey Meat
7.9.1 Prices by Product
7.9.2 Prices by Country of Origin
7.9.3 Prices by Importing Company
8. RUSSIAN TURKEY MEAT MARKET BALANCE
9. 2012-2015 OUTLOOK FOR RUSSIAN TURKEY MEAT MARKET
APPENDIX 1. FEDERAL SUBJECTS OF RUSSIA
ABOUT GLOBAL REACH CONSULTING (GRC)
LIST OF FIGURES
Figure 1. Most Popular Turkey Breeds in Russia
Figure 2. Types of Turkey Used in Industrial Processing
Figure 3. Production of GDP, 1995-2011, Current Prices; Billion Rubles
Figure 4. Physical Volume Indices of GDP, 2000-2011, at Constant Prices; % of the Corresponding Period of Previous Year
Figure 5. Physical Volume Indices of GDP by Economic Activity, 2010-2011, at Constant Prices; % of the Corresponding Period of Previous Year
Figure 6. Industrial Production Index, 2000-2011, as % of the Corresponding Month of Previous Year
Figure 7. Dynamics of Trade Surplus, Exports and Imports, 2000-2011, Billion $
Figure 8. Actual and Estimated Urals Oil Prices, 2005-2015, Dollars per Barrel
Figure 9. Main Macroeconomic Indices, 2002-2015, % of the Previous Year
Figure 10. Main Income Indices, 2002-2015, % of the Previous Year
Figure 11. World Turkey Meat Production, 2006-2012 (F.), 1,000 metric tons and %
Figure 12. Top Countries in Global Turkey Meat Production, 2011, %
Figure 13. World Imports of Turkey Poults, 2006-2010, Thousands of Poults and %
Figure 14. Top Turkey Poults Importers, 2010, %
Figure 15. Geographical Distribution of Turkey Poults Imports, 2010, units
Figure 16. World Imports of Turkey Meat, 2006-2010, 1,000 tons and %
Figure 17. World Turkey Meat Imports by Type, 2010, %
Figure 18. Top Importers of Frozen Turkey Cuts (in Volume Terms), 2010, %
Figure 19. Geographical Distribution of Frozen Turkey Cuts Imports, 2010, units
Figure 20. Top Importers of Fresh or Chilled Cuts of Turkey (in Volume Terms), 2010, %
Figure 21. Geographical Distribution of Fresh or Chilled Turkey Cuts Imports, 2010, units
Figure 22. Top Importers of Frozen Whole Turkey (in Volume Terms), 2010, %
Figure 23. Geographical Distribution of Frozen Whole Turkey Imports, 2010, units
Figure 24. Top Importers of Fresh of Chilled Whole Turkey (in Volume Terms), 2010, %
Figure 25. Geographical Distribution of Fresh of Chilled Whole Turkey Imports, 2010, units
Figure 26. World Exports of Turkey Poults, 2006-2010, 1,000 units and %
Figure 27. Top Turkey Poults Exporters, 2010, %
Figure 28. World Exports of Turkey Meat, 2006-2010, 1,000 tons and %
Figure 29. World Turkey Meat Exports by Type, 2010, %
Figure 30. Top Exporters of Frozen Turkey Cuts (in Volume Terms), 2010, %
Figure 31. Geographical Distribution of Fresh of Chilled Whole Turkey Imports, 2010, units
Figure 32. Top Exporters of Fresh or Chilled Cuts of Turkey (in Volume Terms), 2010, %
Figure 33. Geographical Distribution of Fresh of Chilled Turkey Cuts Exports, 2010, Metric Tons
Figure 34. Top Exporters of Frozen Whole Turkey (in Volume Terms), 2010, %
Figure 35. Geographical Distribution of Frozen Whole Turkey Exports, 2010, Metric Tons
Figure 36. Top Exporters of Fresh of Chilled Whole Turkey (in Volume Terms), 2010, %
Figure 37. Geographical Distribution of Fresh of Chilled Whole Turkey Exports, 2010, Metric Tons
Figure 38. Global Turkey Meat Apparent Consumption, 2006-2010, 1,000 Metric Tons
Figure 39. Global Turkey Meat Consumption by Country, 2011, %
Figure 40. Turkey Meat Per Capita Consumption, by country (kg/Cap/Yr.), 2011-2012 (F.)
Figure 41. Global Turkey Meat Production and Trade Forecast, 2010-2011F, 1,000 Metric Tons
Figure 42. Forecast for Turkey Meat Production in Major Producing Countries, 2011– 2012F, 1,000 Metric Tons
Figure 43. Global Turkey Meat Consumption, 2010 -2012 (F.), 1,000 Metric Tons
Figure 44. Turkeys Population by Type of Farm, %
Figure 45. Geographical Distribution of Turkeys by Federal Districts, %
Figure 46. Geographical Distribution of Turkeys by Regions, %
Figure 47. The Share of Agricultural Organizations in the Population of Turkeys in Major Regions, %
Figure 48. Turkey Meat Production in Russia, 2006-2011, 1,000 Metric Tons and %
Figure 49. Dynamics of Turkey meat Production by Type of Farm, 2006-2011, Metric Tons
Figure 50. Share of Agricultural Organization in Turkey Meat Production (in Volume Terms), 2006-2011, %
Figure 51. Structure of Turkey Meat Production by Type of Product (in Volume Terms), %
Figure 52. Classification of Turkey Meat Producers in Russia
Figure 53. Top Turkey Meat Producers in Russia (in Volume Terms), 2011, %
Figure 54. Turkey Hatching Eggs Imports, 2006-2011, 1,000 Units and %
Figure 55. Dynamics of Turkey Hatching Eggs Imports by Top-3 Importing Companies, 2009- 2011, 1,000 units
Figure 56. Structure of Turkey Hatching Eggs Imports by Importing Company (Turkey Farms) in Volume Terms, 2011, %
Figure 57. Dynamics of Average Prices for Turkey Hatching Eggs, 2006-2011, USD/Unit
Figure 58. Turkey Poults Imports, 2006-2011, 1,000 Units and %
Figure 59. Turkey Poults Imports by Country of Origin, Volume, 2011, %
Figure 60. Dynamics of Turkey Poults Imports by Top Importers, 2006-2011, 1,000 Units
Figure 61. Structure of Turkey Poults Imports by Importing Company (Turkey Farms) in Volume Terms, 2011, %
Figure 62. Total Imports of Turkey Meat, 2004-2011, 1,000 Tons and %
Figure 63. Total Imports of Turkey Meat, 2004-2011, Million USD and %
Figure 64. Turkey Meat Imports Structure by Type (HS Code) in Volume Terms, 2011, %
Figure 65. Geographical Distribution of Turkey Meat Imports in Volume and Value Terms, 2011, %
Figure 66. Geographical Distribution of Turkey Cuts Imports (in Volume Terms), 2011, %
Figure 67. Dynamics of Frozen Turkey Cuts Imports by Major Suppliers, 2005-2011, tons
Figure 68. Geographical Distribution of Frozen Turkey Cuts Imports to Russia, 2005-2011, Metric Tons
Figure 69. Dynamics of Fresh or Chilled Turkey Cuts Imports, 2004-2011, Tons
Figure 70. Geographical Distribution of Fresh or Chilled Turkey Cuts Imports to Russia, 2005-2011, Metric Tons
Figure 71. Geographical Distribution of Frozen Whole Turkey Imports (in Volume Terms), 2011, %
Figure 72. Classification of Importers of Turkey Meat to Russia
Figure 73. Turkey Meat Imports by TOP-5 Importers, 2009-2011, Tons
Figure 74. Russian Turkey Meat Market Dynamics, 2011-2015 F., 1,000 Tons and %
Figure 75. Share of Imports, 2006-2011, %
Figure 76. Russian Turkey Meat Market Forecast, 2011-2015 (F.), 1,000 Tons and %
Figure 77. Forecast for Russian Turkey Meat Production and Imports, 2006-2015, 1,000 Tons
Figure 78. Federal Districts of Russia
Figure 79. Regions of Russia
LIST OF TABLES
Table 1. Proteins, Fats and Calorie in Turkey and Other Meats
Table 2. Body Weight According to Age and Carcass Yield. Heavy Breeds Male and Female
Table 3. Content of Muscles, Skin and Bones in the Breast, Legs and Wings According to Age. Heavy Breeds Male and Female
Table 4. Turkey Carcass Yield, % of Live Weight
Table 5. Major Parameters of Macroeconomic Forecast for 2011-2015
Table 6. Geographical Distribution of World Turkey Meat Production, 2007-2012 (F.), 1,000 metric tons and %
Table 7. Geographical Distribution of Turkey Poults Imports, 2006-2010, units and %
Table 8. World Turkey Meat Imports by Type (HS Code), 2006-2010, tons
Table 9. Geographical Distribution of Frozen Turkey Cuts Imports, 2006-2010, tons and %
Table 10. Geographical Distribution of Fresh or Chilled Turkey Cuts Imports, 2006-2010, tons and %
Table 11. Geographical Distribution of Frozen Whole Turkey Imports, 2006-2010, tons and %
Table 12. Geographical Distribution of Fresh of Chilled Whole Turkey Imports, 2006-2010, tons and %
Table 13. Geographical Distribution of Turkey Poults Exports, 2006-2010, Units and %
Table 14. World Turkey Meat Exports by Type (HS Code), 2006-2010, tons
Table 15. Geographical Distribution of Frozen Turkey Cuts Exports, 2006-2010, tons and %
Table 16. Geographical Distribution of Fresh or Chilled Turkey Cuts Exports, 2006-2010, Metric Tons and %
Table 17. Geographical Distribution of Frozen Whole Turkey Exports, 2006-2010, Metric Tons
Table 18. Geographical Distribution of Fresh of Chilled Whole Turkey Exports, 2006-2010, Metric Tons and %
Table 19. World Aggregate Turkey Meat Market Balance, 2006-2010, 1,000 Metric Tons
Table 20. Global Turkey Meat Consumption by Country, 2007-2012 (F.), 1,000 Metric Tons
Table 21. Geographical Distribution of Turkeys by Federal Districts of Russia and by Type of Farm, 1,000 Heads
Table 22. Geographical Distribution of Turkeys by Region and by Type of Farm, 1,000 Heads
Table 23. Dynamics of Turkey Meat Production, 2006-2011, 1,000 Metric Tons
Table 24. Top Turkey Meat Producers in Russia, 2006-2011, tons and %
Table 25. EURODON LTD Production Volume, 2006-2009, metric tons
Table 26. EURODON LTD Balance Sheet, 2008-2010, 1,000 RUB
Table 27. EURODON LTD Profit and Loss Statement, 2008-2010, 1,000 RUB
Table 28. EURODON LTD Cash Flow Statement, 2008-2010, 1,000 RUB
Table 29. EURODON LTD Financial Ratios, 2006-2010
Table 30. KRASNOBOR CJSC Production Volume, 2006-2009, Metric Tons
Table 31. KRASNOBOR CJSC Balance Sheet, 2008-2010, 1,000 RUB
Table 32. KRASNOBOR CJSC Profit and Loss Statement, 2008-2010, 1,000RUB
Table 33. KRASNOBOR CJSC Cash Flow Statement, 2008-2010, 1,000 RUB
Table 34. KRASNOBOR CJSC Financial Ratios, 2006-2010
Table 35. EGORYEVSKAYA TURKEY FARM LTD Production Volume, 2006-2009, Metric Tons
Table 36. EGORYEVSKAYA TURKEY FARM LTD Balance Sheet, 2008-2010, 1,000 RUB
Table 37. EGORYEVSKAYA TURKEY FARM LTD Profit and Loss Statement, 2008-2010, Thousand RUB
Table 38. EGORYEVSKAYA TURKEY FARM LTD Cash Flow Statement, 2008 - 2010, 1,000 RUB
Table 39. EGORYEVSKAYA TURKEY FARM LTD Financial Ratio, 2006-2010
Table 40. BASHKIR POULTRY COMPLEX NAMED AFTER M. GAFURY LTD, 2009, Metric Tons
Table 41. BASHKIR POULTRY COMPLEX NAMED AFTER M. GAFURY LTD Balance Sheet, 2007-2010, 1,000 RUB
Table 42. BASHKIR POULTRY COMPLEX NAMED AFTER M. GAFURY LTD Profit and Loss Statement, 2007-2010, 1,000 RUB
Table 43. BASHKIR POULTRY COMPLEX NAMED AFTER M. GAFURY LTD Cash Flow Statement LTD, 2009-2010, 1,000 RUB
Table 44. BASHKIR POULTRY COMPLEX NAMED AFTER M. GAFURY LTD Financial Ratios, 2007-2010
Table 45. ZADONSKAYA POULTRY FACTORY CJSC Production Volume, 2006-2009, Metric Tons
Table 46. ZADONSKAYA POULTRY FACTORYCJSC Balance Sheet, 2007-2010, 1,000 RUB
Table 47. ZADONSKAYA POULTRY FACTORY CJSC Profit and Loss Statement, 2007-2010, 1,000 RUB
Table 48. ZADONSKAYA POULTRY FACTORY CJSC Cash Flow Statement , 2007-2010, 1,000 RUB
Table 49. ZADONSKAYA POULTRY FACTORY CJSC Financial Ratios, 2007-2010
Table 50. Customs Duties for Turkey Meat Imports and Exports, 2012
Table 51. Turkey Hatching Eggs Imports by Country of Origin, 2006-2011, 1,000 Units and %
Table 52. Turkey Hatching Eggs Imports by Country of Origin, 2006-2011, $1,000 and %
Table 53. Turkey Hatching Eggs Imports by Producing Company, 2006-2011, 1,000 Units and %
Table 54. Turkey Hatching Eggs Imports by Importing Company, 2006- 2011, 1,000 Units and %
Table 55. Turkey Hatching Eggs Imports by Importing Company, 2006 – 2011, $1,000 and %
Table 56. Average Prices for Turkey Hatching Eggs by Importing Company, 2006-2011, USD/Unit
Table 57. Turkey Poults Imports by Country of Origin, 2006 - 2011, 1,000 Units and %
Table 58. Turkey Poults Imports by Country of Origin, 2006 - 2011, $1,000
Table 59. Turkey Poults Imports by Importing Company, 2006-2011, 1,000 Units
Table 60. Average Prices for Turkey Poults by Importing Company, 2006-2011, USD/Unit
Table 61. Turkey Meat Imports Structure by HS Codes, 2011, Metric Tons, $1,000 and %
Table 62. Imports of Turkey Meat by Country of Origin,2010-2011, Tons and $1,00, %
Table 63. Imports of Frozen Turkey Cuts and Offal by Country of Origin, 2005-2011, tons and %
Table 64. Imports of Fresh or Chilled Turkey Cuts by Country of Origin, 2005-2011, Metric Tons %
Table 65. Imports of Frozen Whole Turkey by Country of Origin, 2005- 2011, tons and %
Table 66. Turkey Meat Imports by Importing Company (TOP 116), 2011, Tons and $1,000, %
Table 67. Turkey Meat Prices at the Customs, 2010-2011, USD/kg
Table 68. Turkey Meat Prices by Country of Origin, 2010-2011, USD/kg
Table 69. Average Turkey Meat Prices by Importing Company, 2011, USD/kg
Table 70. Russian Turkey Meat Market Balance, 2006-2011, 1,000 Tons
Исследования по теме «Птица и яйцо»
Обзоры по теме «Пищевая промышленность и продовольствие»
все обзоры
На российском рынке пшеничного крахмала отечественная продукция постепенно вытесняет импорт. Производители модернизируют и расширяют свои заводы, а потребители проявляют все больший интерес к отечественному продукту. Эти процессы влияют на весь рынок: распределение продукции между отраслями, объемы поставок и возможности для экспорта. Компаниям приходится работать в новых условиях и адаптироваться к происходящим изменениям.
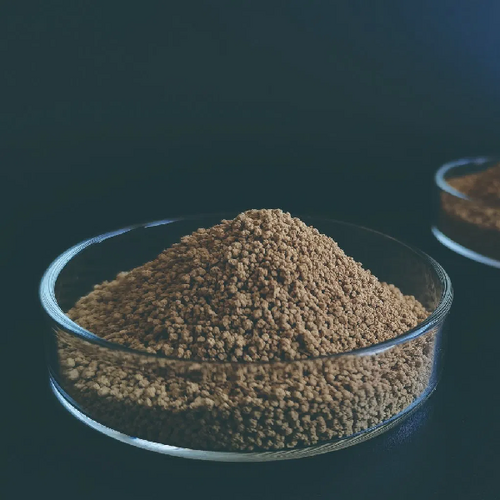
Рынок кормовых аминокислот играет ключевую роль в обеспечении полноценного питания скота, птицы и рыбы, влияя на их рост, продуктивность и здоровье. В настоящее время он в значительной степени зависит от импорта, однако, по оценке наших аналитиков, уже в ближайшие 5–7 лет российское производство не только закрое все внутренние потребности российского рынка, но и обеспечит значительные объемы продукции для экспорта.
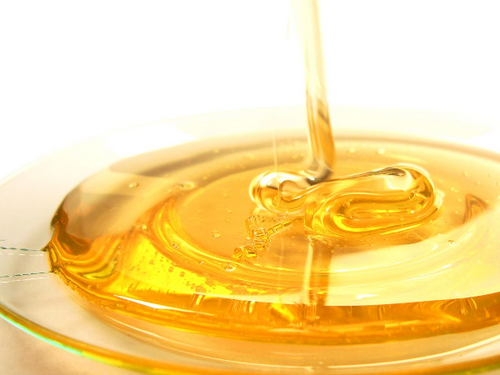
Российский рынок крахмальной патоки в последние годы демонстрирует относительную стабильность как по объемам внутреннего производства, так и по экспорту. С одной стороны, это обеспечивается устойчивым уровнем потребления в пищевой и кормовой промышленности, с другой — налаженными поставками в страны СНГ, где продукт пользуется постоянным спросом.


