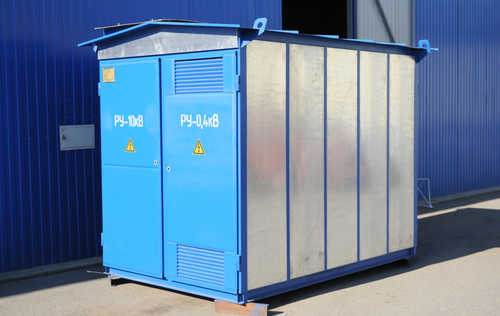
Ukrainian Power Generation
- Дата выхода отчёта: 21 марта 2007 г.
- География исследования: Украина
- Период исследования: 2006 (актуализация по запросу)
- Язык отчёта: Английский
- Способ предоставления: электронный
-
Содержание
1. Investment Case
Investors eye energy appreciation prize
EV/Capacity - oriented
Valuation revision
2. 52 weeks: +200%
Excess demand pulled prices up
Praying for liquidity
Market can't hardly wait for future improvements
A new discount equilibrium?
Early spring thaw melted traditional discount to OGKs
Why the discount holds
1. Need for reform
Russia: Urgent problem
Ukraine: At least a 3-year lag
2. Stock promotion
Russia: RAO UES and OGKs see benefits from stock appreciation
Ukraine: Poor corporate governance and lack of independence
3. Privatization
Russia: Clear privatization schedule
Ukraine: Only count on small stakes to be privatized
Exports promise further discount reductions
1. Larger capacity utilization
2. Export reform: Profitability booster?
The more progress in exports, the lower the discount to OGKs
3. Solving the multiples valuation puzzle
EV/EBITDA: Not very telling
Case study: Margins decreased in 2006
Probably undervalued by EV/S
EV/Capacity: Definitely undervalued
4. DCF: Grounded solutions
DCF model passes quality control checks
Conclusions:
Base-case scenario: Downside as expected
Best-case scenario: Outlining the ceiling
5. Valuation summary
6. Company profiles
6.1 Centrenergo
INVESTMENT CASE
SHARE PRICE PERFORMANCE - chart
BUSINESS OVERVIEW
MARKET INFORMATION - table
STOCK OWNERSHIP - table
MARKET MULTIPLES - table
KEY RATIOS - table
Electricity Production - chart
6.2 Dniproenergo
INVESTMENT CASE
SHARE PRICE PERFORMANCE - chart
BUSINESS OVERVIEW
MARKET INFORMATION - table
STOCK OWNERSHIP - table
MARKET MULTIPLES - table
KEY RATIOS - table
Electricity Production - chart
6.3 Donbassenergo
INVESTMENT CASE
SHARE PRICE PERFORMANCE - chart
BUSINESS OVERVIEW
MARKET INFORMATION - table
STOCK OWNERSHIP - table
MARKET MULTIPLES - table
KEY RATIOS - table
Electricity Production - chart
6.4 Zakhidenergo
INVESTMENT CASE
SHARE PRICE PERFORMANCE - chart
BUSINESS OVERVIEW
MARKET INFORMATION - table
STOCK OWNERSHIP - table
MARKET MULTIPLES - table
KEY RATIOS - table
Electricity Production - chart
7. Appendices
Appendix 1: Peer comparison
Output and financials
Appendix 2: Key drivers for export growth
Lack of capacity in Russia
Growing demand in the west
UCTE integration
Appendix 3: Gas-fueled capacity - If it's not loaded, it doesn't count
8. Analyst Certification
CHARTS
Market
Relative performance
GenCos vs. OGKs indices
Trading history, Monthly data
Monthly free float turnover, Shares
Stock indices (MCap-weighted)
GenCos discount to OGKs by EV/Capacity
Pure generation companies: EV/EBITDA 2007E
Pure generation companies: EBITDA margins 2006
EV/Sales 2007E
EV/Sales vs. EBITDA margins, 2007E
EV/Capacity, USD/kW
EV/Utilized Capacity 2006, USD/kW
EV/Capacity vs EBITDA(07E)/Capacity
Model revision summary: base-case scenario - CEEN
Model revision summary: base-case scenario - DNEN
Model revision summary: base-case scenario - DOEN
Model revision summary: base-case scenario - ZAEN
Model assumptions that justify current GenCo prices
Russian regions with an energy-deficit last winter
Summary map: potential export winners
TABLES
Target price revision, USD
Capacity and output
Financial summary, USD mln
Market ratios (07E)
Shareholders
Valuation summary, USD
2007 Multiples: GenCos
OGKs
Capacity utilization rates of power producers
Average wholesale tariffs, USD/MWh
EBITDA margins
Valuation by EBITDA/Capacity (benchmarking to lower 95% regression interval)
Key assumptions
DCF vs. the market, USD
DCF valuation at the best-case scenario
Valuation summary, USD
Implied 12M upside summary
Centrenergo - Income Statement Summary
Centrenergo - Balance Sheet Summary
Centrenergo - Quarterly Analysis
Centrenergo - Base-case DCF model output
Centrenergo - Sensitivity analysis
Dniproenergo - Income Statement Summary
Dniproenergo - Balance Sheet Summary
Dniproenergo - Quarterly Analysis
Dniproenergo - Base-case DCF model output
Dniproenergo - Sensivity analysis
Donbassenergo - Income Statement Summary
Donbassenergo - Balance Sheet Summary
Donbassenergo - Quarterly Analysis
Donbassenergo - Base-case DCF model output
Donbassenergo - Sensivity analysis
Zakhidenergo - Income Statement Summary
Zakhidenergo - Balance Sheet Summary
Zakhidenergo - Quarterly Analysis
Zakhidenergo - Base-case DCF model output
Zakhidenergo - Sensivity analysis
Per MWh financial ranking (2006E, USD)
Utilization rates of installed generation capacity
Market multiples, 2007E
EV/Capacity, USD/kW


