Market of flour confectionery: complex analysis and forecast until 2016
- Дата выхода отчёта: 23 октября 2014 г.
- География исследования: Россия
- Период исследования: 2014 (актуализация по запросу)
- Язык отчёта: Английский
- Способ предоставления: электронный
-
Описание
-
Содержание
METHODOLOGY OF RESEARCH
Subject of research:
MARKET OF FLOUR CONFECTIONERY
Purpose of reserch:
EVALUATION OF THE MARKET STATE AND FORECAST FOR ITS DEVELOPMENT FOR 2015-2016
Regions of research:
RUSSIA, REGIONS OF THE RF
Main blocks of research:
ANALYSIS OF RETAIL SALES OF CONFECTIONERY IN RUSSIA
VOLUME OF THE RUSSIAN MARKET OF FLOUR CONFECTIONERY
SEGMENTATION OF THE MARKET OF FLOUR CONFECTIONERY
RAW MATERIALS BASE FOR FLOUR CONFECTIONERY PRODUCTION
PRODUCTION OF FLOUR CONFECTIONERY IN RUSSIA
PRODUCTION IN SEPARATE SEGMENTS
THE LARGEST RUSSIAN PRODUCERS OF FLOUR CONFECTIONERY
ANALYSIS OF EXPORT OF FLOUR CONFECTIONERY
ANALYSIS OF IMPORT FLOUR CONFECTIONERY
PRODUCERS’ PRICES FOR FLOUR CONFECTIONERY
RETAIL PRICES FOR FLOUR CONFECTIONERY IN RUSSIA
TRENDS ON THE RUSSIAN MARKET OF FLOUR CONFECTIONERY
STATE REGULATION OF THE MARKET OF FLOUR CONFECTIONERY
DISTRIBUTION CHANNELS ON THE MARKET OF FLOUR CONFECTIONERY
CONSUMER PREFERENCES ON THE MARKET OF FLOUR CONFECTIONERY
FORECAST FOR DEVELOPMENT OF THE MARKET OF FLOUR CONFECTIONERY FOR 2015-2016
Types of flour confectionery researched herein:
Waffles
Hard biscuits and crackers
Biscuits (sweet, ginger)
Muffins
Rolled cakes
Pryaniki
Ginger cakes
Tortes
Cakes
Eastern sweets
The largest Russian enterprises profiled:
«KDV YASHKINO», LLC
«AKKOND», OJSC
«KONTI-RUS», CJSC
«CHIPITA SAINT PETERSBURG», LLC
«FILI-BAKERS», LLC
The largest enterprises are presented by production volume, financial activity, sheet balances, profit and loss statements, cash-flow statements, subsidiaries and other information.
Information sources used:
FederalStateStatistics Service
Ministry of Economic Development of RF
Federal Custom Service
Federal Tax Service
Evaluation of Experts of the Branch
Retail sales statements
Data of the main players of the branch
Printed and electronic publications of the branch
The research contains 98 schedules, 60 diagrams, 120 tables and 1 figure.
EXTRACTS FROM RESEARCH
CHAPTER 3. VOLUME OF RUSSIAN MARKET OF FLOUR CONFECTIONERY
A two year crisis decrease (2008 - 2009) in the dynamics of Russian import of flour confectionery followed by growth of import deliveries started in 2010. Amout of products imported in 2011was by 25.7% larger than in the previous year; in 2012-2013 increase rates were at the level of 8-9%.
Against a slowed down increase of production, active growth of import affected share of foreign products on Russian market. According to the experts of Intesco Research Group in 2013 import products reached **% of the market, that is by 1.3 p.p. exceeds values of 2010. Considering an increasing demand for non-traditional flour products among Russian population, foreign companies are able to enlarge their share in Russia.
CHAPTER 11. ANALYSIS OF IMPORT OF FLOUR CONFECTIONERY
In 2007 – 2009 volume of flour confectionery imporedt to Russia was characterized by тупфешму dynamics. In two years deliveries reduced by 18.6% or ** ths. t. However from 2010 volumes started recovering, and already in 2011 they exceeded the values of 2007. It should be noted that the largest increase in volumes of import products (more than by one fourth) was recorded exactly in 2011.
In 2013 ** ths. t of products were delivered to Russian market. It is by 8.1% more than the value of 2012.
The larhest share in the structure of Russian import of flour confectionery in 2013 was constituted by dry sweet biscuits – 7**%. One fifth was made up by waffles and wafers (**.*%) and only 2% belonged to ginger bicuits and similar products.
CHAPTER 13. PRODUCERS’ PRICES FOR FLOUR CONFECTIONERY
During 2008-2013 growth of sale prices for waffles has been observing. In 2013 the price grew almost 2 times in comparison to 2008 and amounted to **.7 ths. rub/t. At that it should be noted that during last two years increase rate of prices for waffles was lower than the official inflation rate (*% in 2013).
Throughout the period analyzed average producers’ prices for biscuits demonstrated a steady growth. The largest increase in prices was recorded in 2009 and 2011 – +**% each year. In 2013 an analogous value amounted to **%. Therefore in 2013 producers’ sale prices for biscuits in Russia increased almost two times in comparison to 2008 and reached **.5 ths. rub/t.
In 2010 due to amendments to All-Russian Classification of Products producers’ prices for biscuits have been considered including two more items: sweet biscuits and dry biscuits (hard biscuits and crackers).
Average price for sweet biscuits amounted to *7.4 ths. rub/t in 2013. This value exceeds price for hard biscuits and crackers by 16.9 ths. rub/t, which were sold at a price of *0,4 ths. rub/t.
METHODOLOGY OF RESEARCH
LIST OF SCHEDULES, DIAGRAMS, TABLES AND SCHEMES
1. GENERAL ECONOMIC SITUATION IN RUSSIA
1.1. Population of Russia
1.2. Economic situation
1.3. Special economic zones
1.4. Entrepreneurship development in Russia
1.5. Investment potential
1.6. Position of Russia in the world
2. SUBJECT OF RESEARCH
2.1. Basic definitions and identification of flour confectionery goods
2.2. Classification of flour confectionery
Classification by FEA CN
Classification by ARCP
Classification by ARCPEA
All-Russian Classifier of Types of Economic Activity
3. VOLUME OF RUSSIAN FLOUR CONFECTIONERY GOODS MARKET
3.1. Dynamics of flour confectionery goods market volume by years in physical terms
3.2. Import share on the Russian flour confectionery market
3.3. Dynamics of import share on the Russian flour confectionery market
3.4. Consumption of flour confectionery per capita
4. SEGMENTATION OF RUSSIAN FLOUR CONFECTIONERY MARKET
4.1. Segmentation by groups of confectionery
4.1. Segmentation of products by shelf-life
4.2. Segmentation of products by types
5. ANALYSIS OF CONFECTIONERY RETAILS IN RUSSIA
5.1. Dynamics by years
5.2. Dynamics by quarters
5.3. Structure by federal districts of RF
5.4. The largest regions of RF by retail sales
5.5. Regional structure of retail sales
6. RAW MATERIALS BASE. FLOUR
6.1. Dynamics of production volumes by years
6.2. Dynamics of production volumes by months
6.3. Production volumes in federal districts of Russia
6.4. Structure of production by federal districts of RF
6.5. Volumes of production in regions of RF
6.6. Regional structure of production
6.7. Producers’ prices
6.8. Retail prices
7. PRODUCTION OF FLOUR CONFECTIONERY IN RUSSIA
7.1. Dynamics by years
7.2. Dynamics by months
7.3. Volumes by federal districts of RF
7.4. Structure by federal districts of the RF
7.5. Volumes by regions of the RF
7.6. Regional structure
8. STRUCTURE OF CONFECTIONERY PRODUCTION
8.1. Segmentation by confectionary types
8.2. Segmentation by flour confectionery types
9. PRODUCTION IN SEPARATE SEGMENTS OF FLOUR CONFECTIONERY
9.1. Long shelf life confectionery
Waffles
Sweet biscuits
Ginger biscuits
Hard biscuits and crackers
Muffins
Rolled cakes
Pryaniki
Ginger cakes
Rum babas
9.2. Flour confectionery of short shelf life
Tortes
Cakes
Eastern confectionary
10. THE LARGEST RUSSIAN PRODUCERS OF FLOUR CONFECTIONERY
10.1. Enterprises of the field by proceeds
10.2. Enterprises rated by profitability
10.3. Structure of enterprise location by regions
11. ANALYSIS OF FLOUR CONFECTIONERY IMPORT
11.1. Flour confectionery (total volume)
Dynamics of volume by years and months
Structure by supplying countries
Structure by types
11.2. Waffles
Dynamics of volume by years
Dynamics of volume by months
Structure by supplying countries
11.3. Biscuits
Dynamics of volume by years
Structure by supplying countries
11.4. Ginger biscuits
Dynamics of volume by years
Dynamics of volume by months
Structure by supplying countries
12. ANALYSIS OF FLOUR CONFECTIONERY EXPORT
12.1. Flour confectionery (in total)
Dynamics of volume by years
Structure by countries of destination
Structure by types
12.2. Waffles
Dynamics of volumes by years
Dynamics of volumes by months
Structure by countries of destination
12.3. Biscuits
Dynamics of volumes by years
Dynamics of volumes by months
Structure by countries of destination
12.4. Ginger biscuits
Dynamics of volumes by years
Dynamics of volumes by months
Structure by countries of destination
13. PRODUCERS’ PRICES FOR RLOUR CONFECTIONERY
13.1. Tortes and cakes
Dynamics by years
Dynamics by months
13.2. Waffles
Dynamics by years
Dynamics by months
13.3. Biscuits
Dynamics by years
Dynamics by months
13.4. Pryaniki and ginger cakes
Dynamics by years
Dynamics by months
14. RETAIL PRICES FOR FLOUR CONFECTIONERY IN RUSSIA
14.1. Biscuits
Dynamics by years
Dynamics by months
14.2. Pryaniki
Dynamics by years
Dynamics by months
14.3. Muffins and rolled cakes
Dynamics by years
Dynamics by months
14.4. Tortes
Dynamics by years
Dynamics by months
15. TRENDS ON THE RUSSIAN FLOUR CONFECTIONERY MARKET
15.1. Foreign technologies or unique products
15.2. Confectionery package
15.3. Segment of special products: healthy, kosher, halal
15.4. Confectionery range expansion
15.5. Frozen semi-finished products and confectionery
15.6. Food ingredients in confectionery production
16. DISTRIBUTION CHANNELS ON THE MARKET OF CONFECTIONERY
16.1. Development of new channels formats
16.2. Retail chains
16.3.Producers own retail sale
16.4. Online shops
17. STATE REGULATIONS OF FLOUR CONFECTIONERY MARKET
17.1. Marking and labeling of confectionery products
17.2. Price regulation
17.3. Duties for the confectionery in WTO and Customs Union
17.4. Confectionery industry development strategy
18. CONSUMER PREFERENCES ON FLOUR CONFECTIONERY GOODS MARKET
18.1. Consumer preferences on flour confectionery market
18.2. Small piece confectionery goods
18.3. Preferences on the market of biscuits
19. PROFILES OF THE LARGEST ENTERPRISES BY CONFECTIONERY GOODS PRODUCTION
19.1. «KDV Yashkino» LLC
Reference information
Types of activity
Types of activity
Production volumes
Balance sheet
Profit and loss statement
Cash-flow statement
Financials
19.2. AKKOND, OJSC
Reference information
Types of activity
Production volumes
Balance Sheet
Profit and loss statement
Cash flow statement
Financials
19.3. KONTI-RUS, CJSC
Reference information
Types of activity
Production volumes
Balance sheet
Profit and loss statement
Cash flow statement
Financials
19.4. «Chipita Saint Petersburg» LLC
Reference information
Production volumes
Balance sheet
Profit and loss statement
Cash-flow statement
19.5. «FILI-BAKER», LLC
Reference
Types of activity
Balance sheet
Profit and loss statement
Financials
20. FORECAST OF THE MARKET OF FLOUR CONFECTIONERY DEVELOPMENT FOR 2015-2016
ABOUT INTESCO RESEARCH GROUP
List of schedules
Schedule 1. Population of Russia in 1990, 2000, 2005 and 2008-2013 and forecast for 2014-2016, mln. people
Schedule 2. Dynamics of population of Russia in three different variants of the forecast in 2014-2031, ths. people
Schedule 3. Dynamics of real household disposable income of population and its annual rate of growth in 2000-2013* and a forecast for 2014-2016, %
Schedule 4. Dynamics of dependency ratio in three variants of the forecast in 2014 – 2031.
Schedule 5. Dynamics of employed and unemployed in Russia in 2000 –2013 and forecast until 2014-2015, %
Schedule 6. Dynamics of unemployment share in economically active population by federal districts of RF in 2007-2013, %
Schedule 7. Dynamics of GDP in money terms of 2008 in 2004-2013 and forecast for 2014-2016 bln. rubles
Schedule 8. Dynamics of the GDP of Russia in the current prices in 2004-2013 , and forecast for 2014-2016 , bln rub
Schedule 9. Dynamics of investments into the stock capital of the RF in 2004-2013 and forecast for 2014-2016 , bln. rub
Schedule 10. Dynamics of surplus/deficit of the consolidated budget of the RF in 2006 – 2013 and forecast for 2014-2016, % to GDP
Schedule 11. Dynamics of total external debt of RF and its share in GDP in 2010-2014 (as of January, 1) and forecast for 2015-2017 , mln dollars
Schedule 12. Dynamics of CPI in 2006-2013 and forecast for 2014-2016, % to the corresponding period of the previous year
Schedule 13. Dynamics of investments into special economic zones in 2006-2013 (as of 01.10.2013), mln. rub.
Schedule 14. Number of residents of special economic zones in Russia in 2006- 2013 (June 2013) , units
Schedule 15. Dynamics of volume of cumulative foreign investments in 2005-2013, bln. dollars
Schedule 16. Dynamics of population of Russia and the world in 2000-2013 and forecast until 2100, mln. people
Schedule 17. Share of RF in the world GDP in 2001-2013 and forecast for 2014-2016, %
Schedule 18. Dynamics of flour confectionery goods market volume in 2010-2013, ths.t
Schedule 19. Consumption of flour confectionery per capita in Russia in 2010-2013, kg per capita
Schedule 20. Dynamics of retail sales of confectionery in Russia in 2009-2013, bln. rub.
Schedule 21. Dynamics of retail sales of confectionery in Russia by quarters in 2009-2013, bln. rub.
Schedule 22. The largest regions of Russia by retail sales volumes of confectionery in 2013, bln. rub.
Schedule 23. Dynamics of volumes of Russian production of flour in 2010-2013, ths. tons
Schedule 24. Dynamics of volumes of Russian production of flour by months in 2010 – February 2014, tons
Schedule 25. Dynamics of production of flour in federal districts in Russia in 2010-2013, tons
Schedule 26. Dynamics of average producers’ prices for flour in Russia in 2007-April 2013, rub/t
Schedule 27. Dynamics of average retail prices for wheat flour in RF in 2009-2013, rub/kg
Schedule 28. Dynamics of volume of Russian production of flour confectionery and galletes in 2010-2013, t
Schedule 29 Dynamics of volume of Russian production of flour confectionery by months in 2010-February 2014, t
Schedule 30 Dynamics of volume of Russian production of flour confectionery by federal districts in 2010-2013, t
Schedule 31. Dynamics of Russian production ogf flour confectionery of long shaelf life in 2010 – 2013, t
Schedule 32. Dynamics of Russian production of flour confectionery of long shelf life by federal districts in 2010 – 2013, t
Schedule 33. Volume of Russian production of long shelf life flour confectionery by the largest regions in 2010 – 2013, t
Schedule 34 Dynamics of volume of Russian production of waffles in 2010-2012, t
Schedule 35 Dynamics of volume of Russian production of sweet biscuits in 2010-2012, t
Schedule 36 Dynamics of volume of Russian production of ginger biscuits in 2010-2012, t
Schedule 37 Dynamics of volume of Russian production of galletes and crackers in 2010-2012, t
Schedule 38 Dynamics of volume of Russian production of muffins in 2010-2012, t
Schedule 39 Dynamics of volume of Russian production of rolled cakes in 2010-2012, t
Schedule 40 Dynamics of volume of Russian production of pryaniki in 2010-2012, t
Schedule 41 Dynamics of volume of Russian production of ginger cakes in 2010-2012, t
Schedule 42 Dynamics of volume of Russian production of rum babas in 2010-2012, t
Schedule 43 Dynamics of volume of Russian production of flour confectionery of short shelf life in 2010-2013, t
Schedule 44 Dynamics of Russian production of flour confectionery of short shelf life by federal districts in 2010-2013, t
Schedule 45 Dynamics of volume of Russian production of tortes in 2010-2012, t
Schedule 46 Dynamics of volume of Russian production of cakes in 2010-2012, t
Schedule 47 Dynamics of volume of Russian production of Eastern confectionary in 2010-2012, t
Schedule 48. The largest enterprises with the main type of activity by Russian National Classifier of Economic Activity “Production of dry bread and bakery products and flour confectionery of long shelf life” by proceeds in 2012, mln. rub.
Schedule 49. Dynamics of volumes of flour confectionery import in 2007-2013, t
Schedule 50. Dynamics of volumes flour confectionery import in 2007-2013 , ths. dollars
Schedule 51. Dynamics of volumes of flour confectionery by months in 2009 - March 2014 , t
Schedule 52. Dynamics of volumes of flour confectionery import by months in 2009-March 2014, ths. dollars
Schedule 53. Dynamics of import of waffles and wafers in 2007-2013, tons
Schedule 54. Dynamics of import of waffles and wafers in 2007-2013*, ths. dollars
Schedule 55. Dynamics of import of waffles and wafers by months in 2009-March 2014, tons
Schedule 56. Dynamics of import of waffles and wafers by months in 2007-March 2013, ths. dollars
Schedule 57. Dynamics of import of sweet dry biscuits in 2007-2013, tons
Schedule 58. Dynamics of import of sweet dry biscuits in 2007-2013, ths. dollars
Schedule 59. Dynamics of import of sweet dry biscuits by months in 2009-March 2014, tons
Schedule 60. Dynamics of import of sweet dry biscuits by months in 2009-March 2014, ths. dollars
Schedule 61. Dynamics of import of ginger biscuits and similar products in 2007-2013, tons
Schedule 62. Dynamics of import of ginger biscuits and similar products in 2007-2013, ths. dollars
Schedule 63. Dynamics of import of ginger biscuits and similar products by months in 2009-March 2014, tons
Schedule 64. Dynamics of import of ginger biscuits and similar products by months in 2009-March 2014, ths. dollars
Schedule 65. Dynamics of flour confectionery export in 2007-2013, tons
Schedule 66. Dynamics of flour confectionery export in 2007-2013, ths. dollars
Schedule 67. Dynamics of export of waffles and wafers in 2007-2013, t
Schedule 68. Dynamics of export of waffles and wafers in 2007-2013, ths. dollars
Schedule 69. Dynamics of export of waffles and wafers by months in 2009-March 2014, t
Schedule 70. Dynamics of export of waffles and wafers by months in 2009-March 2014, ths. dollars
Schedule 71. Dynamics of export of sweet dry biscuits in 2007-2013, t
Schedule 72. Dynamics of export of sweet dry biscuits in 2007-2013*, ths. dollars
Schedule 73. Dynamics of export of sweet dry biscuits by months in 2009-March 2014, t
Schedule 74. Dynamics of export of sweet dry biscuits by months in 2009- March 2014, ths. dollars
Schedule 75. Dynamics of export of ginger biscuits and similar products in 2007-2013, t
Schedule 76. Dynamics of export of ginger biscuits and similar products in 2007-2013, ths. dollars
Schedule 77. Dynamics of export of ginger biscuits and similar products by months in 2009-March 2014, t
Schedule 78. Dynamics of export of ginger biscuits and similar products by months in 2009-March 2014, ths. dollars
Schedule 79. Dynamics of average producers’ prices for tortes and cakes in Russia by years in 2008-2013, rub/t
Schedule 80. Dynamics of average producers’ prices for tortes and cakes in Russia by months in 2008-February 2014, rub/t
Schedule 81. Dynamics of average producers’ prices for waffles in Russia by years in 2008-2013, rub/t
Schedule 82. Dynamics of average producers’ prices for waffles in Russia by months in 2008-February 2014, rub/t
Schedule 83. Dynamics of average producers’ prices for biscuits in Russia by years in 2008-2013, rub/t
Schedule 84. Dynamics of average producers’ prices for biscuits in Russia by months in 2008-February 2014, rub/t
Schedule 85. Average producers’ prices for sweet biscuits and galletes, crackers in Russia by years in 2010-2013, rub/t
Schedule 86. Dynamics of average producers’ prices for pryaniki and ginger cakes by years in Russia in 2008-2013, rub/t
Schedule 87. Dynamics of average producers' prices for pryaniki and ginger cakes in Russia by months in 2008-February 2014, rub/t
Schedule 88. Dynamics of average retail prices for biscuits in Russia by years in 2008-2013, rub/kg
Schedule 89. Dynamics of average retail prices for biscuits in Russia by months in 2008-February 2014, rub/kg
Schedule 90. Dynamics of average retail prices for pryaniki in Russia by years in 2008-2013, rub/kg
Schedule 91. Dynamics of average retail prices for pryaniki in Russia by months in 2008-February 2014, rub/kg
Schedule 92. Dynamics of average retail prices for muffins and rolled cakes in Russia by years in 2008-2013, rub/kg
Schedule 93. Dynamics of average retail prices for muffins and rolled cakes in Russia by months in 2008-February 2014, rub/kg
Schedule 94. Dynamics of average retail prices for tortes in Russia by years in 2008-2013, rub/kg
Schedule 95. Dynamics of average retail prices for tortes in Russia by months in 2008-February 2014, rub/kg
Schedule 96. Small piece confectionary products consumption volume in Moscow in 2013 (N=348), people
Schedule 97. Dynamics of volume of the Russian market of flour confectionery in 2010-2013 and forecast for 2014-2016, ths. t
Schedule 98. Dynamics of import share on the Russian market of flour confectionery in 2010-2016*, %
List of diagrams
Diagram 1. Structure of population of Russia to working age in 2014- 2031, % (middle variant of the forecast)
Diagram 2. Change of structure of incomes of the federal budget in2009-2013, %
Diagram 3. Change of structure of external debt of RF in 2009-2014 (as of January 1), %
Diagram 4. Foreign investments accumulated by investing countries in 2013, %
Diagram 5. Import share on the Russian flour confectionery market in 2013, %
Diagram 6. Dynamics of import share on the Russian flour confectionery market in 2010-2013, %
Diagram 7. Change of structure of the Russian market of confectionery by categories in 2010-2013*, %
Diagram 8. Change of structure of the Russian market of flour confectionery by shelf-life of products in 2010-2013*, %
Diagram 9. Change of structure of the Russian market of flour confectionery by types in 2010-2013*, %
Diagram 10. Structure of retail sales of confectionery in Russia by federal districts in 2013, %
Diagram 11. Change of structure of retail sales of confectionery in Russia by federal districts in 2009-2013, %
Diagram 12. Regional structure of retail sales of confectionery in Russia in 2013, %
Diagram 13. Change of regional structure of retail sales of confectionery in Russia in 2009-2013, %
Diagram 14. Change of structure of Russian production of flour by federal districts in 2010-2013, %
Diagram 15. Change of regional structure of Russian production of flour in 2010-2013, %
Diagram 16. Change of structure of Russian production of flour confectionary by federal districts in 2010 - 2013, %
Diagram 17. Change of structure of Russian production of flour confectionary by regions in 2010 – 2013, %
Diagram 18. Structure of Russian production of confectionery by types in 2013*, %
Diagram 19. Change of structure of Russian production of confectionery and hard biscuits by types in
Diagram 20. Change of structure of Russian production of confectionaery and hard biscuits by types in 2010 – 2013*, %
Diagram 21. Change of structure of Russian production of flour confectionery by shelf life in 2010 - 2013, %
Diagram 22. Change of structure of Russian production of flour confectionery and hard biscuits by types in 2010 – 2013*, %
Diagram 23. Change of the structure of Russian production of long shelf life flour confectionery by federal districts in 2010 - 2013, %
Diagram 24 Change of structure of Russian long shelf life production by regions in 2010-2013, %
Diagram 25 Change of structure of Russian production of waffles by federal districts in 2010-2012, %
Diagram 26 Change of structure of Russian production of sweet biscuits by federal districts in 2010-2012, %
Diagram 27 Change of structure of Russian production of ginger biscuits by federal districts in 2010-2012, %
Diagram 28 Change of structure of Russian production of galletes and crackers by federal districts in 2012, %
Diagram 29 Change of structure of Russian production of muffins by federal districts in 2010-2012, %
Diagram 30 Change of structure of Russian production of rolled cakes by federal districts in 2010-2012, %
Diagram 31 Change of structure of Russian production of pryaniki by federal districts in 2010-2012, %
Diagram 32 Change of structure of Russian production of ginger cakes by federal districts in 2010-2012, %
Diagram 33 Change of structure of Russian production of rum babas by federal districts in 2010-2012, %
Diagram 34 Change of structure of Russian production of flour confectionery of short shelf life by federal districts in 2010-2013, %
Diagram 35 Change of structure of Russian production of tortes by federal districts in 2010-2012, %
Diagram 36 Change of structure of Russian production of cakes by federal districts in 2010-2012, %
Diagram 37. Change of structure of Russian production of Eastern confections by federal districts in 2010-2012, %
Diagram 38. Regional structure of enterprises location with the main type of activity by All-Russian Classifier of Types of Economic Activity “Production of long shelf life dry bread and flour confectionery products” in April, 2014, %
Diagram 39. Structure of confectionery import in physical terms in 2013, %
Diagram 40. Structure of flour confectionery import in cost terms in 2013, %
Diagram 41. Structure of flour confectionery import by types in physical terms in 2013, %
Diagram 42. Structure of flour confectionery import by types in cost terms in 2013, %
Diagram 43. Structure of import of waffles and wafers in physical terms in 2013, %
Diagram 44. Structure of import of waffles and wafers in cost terms in 2013, %
Diagram 45. Structure of import of sweet dry biscuits in physical terms in 2013, %
Diagram 46. Structure of import of sweet dry biscuits in cost terms in 2013, %
Diagram 47. Structure of import of ginger biscuits and similar products in physical terms in 2013, %
Diagram 48. Structure of import of ginger biscuits and similar products in cost terms in 2013, %
Diagram 49. Structure of flour confectionery export by countries in physical terms in 2013, %
Diagram 50. Structure of flour confectionery export by countries in cost terms in 2013, %
Diagram 51. Structure of flour confectionery export by types in physical terms in 2013, %
Diagram 52. Structure of flour confectionery export by types in cost terms in 2012, %
Diagram 53. Structure of export of waffles and wafers in physical terms in 2013, %
Diagram 54. Structure of export of waffles and wafers in cost terms in 2013, %
Diagram 55. Structure of export of sweet dry biscuits in physical terms in 2013, %
Diagram 56. Structure of export of sweet dry biscuits in cost terms in 2013, %
Diagram 57. Structure of export of ginger biscuits and similar products in physical terms in 2013, %
Diagram 58. Structure of export of ginger biscuits and similar products in cost terms in 2013, %
Diagram 59. Lump-sum expenses for small piece confectionery products in 2013, %
Diagram 60. Consumption of different types of eastern sweets by groups of population in 2013, % from respondents
List of tables
Table 1. . Population of the largest cities of Russia according to the Census of 2002 and 2010 as for January, 1, 2013, ths. People
Table 2. Number of small enterprises (without micro enterprises) by the branches in Russia in 2009 – September 2013
Table 3. Values for 2012-2013 of the countries gained the largest success in the branches studied for the «Doing Business 2014» rating
Table 4. Distribution of Russian regions by the rating of investment climate in 2012-2013
Table 5. Dynamics of volume of accumulated foreign investments in TOP-15 of regions in 2005-2013 , mln. dollars
Table 6. Volumes of retail sales of confectionery by quarters in 2009-March 2013, bln. rub.
Table 7. Volumes of retail sales of confectionery in federal districts of RF in 2009-2013, ths. rub.
Table 8. Volumes of retail sales of confectionery by regions of RF in 2009-2013, ths. rub
Table 9. Dynamics of volume of Russian production of flour by months in 2010-February 2014, tons
Table 11. Volumes of production of flour in regions of RF in 2010-2013, tons
Table 12. Dynamics of average producers’ prices for flour in RF by months in 2007-February 2014, rub/t
Table 13. Dynamics of average retail prices for wheat flour by months in 2009-February 2014, rub/kg
Table 14 Volume of Russian production of flour confectionery by months in 2010-February 2014, t
Table 15 Volume of Russian production of flour confectionery by federal districts in 2010-February 2014, t
Table 16. Volume of Russian production of flour confectionary by regions in 2010 - February 2014, t
Table 17. Volume of Russian production of flour confectionery of long shelf life by federal districts in 2010 – February 2014, t
Table 18 Volume of Russian production of long shelf life flour confectionery by regions in 2010-February 2014, t
Table 19 Volume of Russian production of waffles by federal districts in 2010-2012, t
Table 20 Volume of Russian production of waffles by regions in 2010-2012, t
Table 21 Volume of Russian production of sweet biscuits by federal districts in 2010-2012, t
Table 22 Volume of Russian production of sweet biscuits by regions in 2010-2012, t
Table 23 Volume of Russian production of ginger biscuits by federal districts in 2010-2012, t
Table 24 Volume of Russian production of ginger biscuits by regions in 2010-2012, t
Table 25 Volume of Russian production of galletes and crackers by federal districts in 2010-2012, t
Table 26 Volume of Russian production of galletes and crackers by regions in 2010-2012, t
Table 27 Volume of Russian production of muffins by federal districts in 2010-2012, t
Table 28 Volume of Russian production of muffins by regions in 2010-2012, t
Table 29 Volume of Russian production of rolled cakes by federal districts in 2010-2012, t
Table 30 Volume of Russian production of rolled cakes by regions in 2010-2012, t
Table 31 Volume of Russian production of pryaniki by federal districts in 2010-2012, t
Table 32 Volume of Russian production of pryaniki by regions in 2010-2012, t
Table 33 Volume of Russian production of ginger cakes by federal districts in 2010-2012, t
Table 34 Volume of Russian production of ginger cakes by regions in 2010-2012, t
Table 35 Volume of Russian production of rum babas by federal districts in 2010-2012, t
Table 36 Volume of Russian production of rum babas by regions in 2010-2012, t
Table 37 Volume of Russian production of flour confectionery of short shelf life by federal districts in 2010-February 2014, t
Table 38 Volume of Russian production of flour confectionery of short shelf life by regions in 2010-February 2014, t
Table 39 Volume of Russian production of tortes by federal districts in 2010-2012, t
Table 40 Volume of Russian production of tortes by regions in 2010-2012, t
Table 41 Volume of Russian production of cakes by federal districts in 2010-2012, t
Table 42 Volume of Russian production of cakes by regions in 2010-2012, t
Table 43 Volume of Russian production of Eastern confections by federal districts in 2010-2012, t
Table 44. Volume of Russian production of Eastern confections by regions in 2010-2012, t
Table 45. Rating of the largest enterprises with the main type of activity by Russian National Classifier of Economic Activity “Production of dry bread and bakery products and flour confectionery of long shelf life” by proceeds in 2007-2012, mln. rub.
Table 46. Rating of the largest enterprises with the main type of activity according to All-Russian Classifier of Types of Economic Activity “Production of dry bread and flour confectionery products” by profitability in 2007-2012, %
Table 47. Volumes of flour confectionery import by months in 2009-March 2014 , t
Table 48. Volumes of flour confectionery import by months in 2009-March 2014 , ths. dollars
Table 49. Volumes of flour confectionery import by supplying countries in 2007-2013, t
Table 50. Volumes of flour confectionery import by supplying countries in 2007-2013, ths. dollars
Table 51. Flour confectionery import volumes by types in 2007 - 2013, t
Table 52. Flour confectionery import volumes by types in 2007-2013, ths. dollars
Table 53. Volumes of import of waffles and wafers by months in 2009-March 2014, tons
Table 54. Volumes of import of waffles and wafers by months in 2007-March 2014, ths. dollars
Table 55. Volumes of Russian import of waffles and wafers by supplying countries in 2007-2013, tons
Table 56. Volumes of Russian import of waffles and wafers by supplying countries in 2007-2013, ths. dollars
Table 57. Volumes of import of sweet dry biscuits by months in 2009-March 2014, tons
Table 58. Volumes of import of sweet dry biscuits by months in 2009-March 2014, ths. dollars
Table 59. Volumes of Russian import of sweet biscuits by supplying countries in 2007-2013, tons
Table 60. Volumes of Russian import of sweet biscuits by supplying countries in 2007-2013, ths. dollars
Table 61. Volumes of import of ginger biscuits and similar products by months in 2009-March 2014, tons
Table 62. Volumes of import of ginger biscuits and similar products by months in 2009-March 2014, ths. dollars
Table 63. Volumes of Russian import of ginger biscuits by supplying countries in 2007-2013, tons
Table 64. Volumes of Russian import of ginger biscuits by supplying countries in 2007-2013, ths. dollars
Table 65. Export volumes of flour confectionery by countries of destination in 2007-2013, tons
Table 66. Export volumes of flour confectionery by countries of destination in 2007-2013, ths. dollars
Table 67. Export volumes of flour confectionery by types in 2007-2013, t
Table 68. Export volumes of flour confectionery by types in 2007-2013, ths. dollars
Table 69. Export volumes of waffles and wafers by months in 2009-March 2014, t
Table 70. Export volumes of waffles and wafers by months in 2009-March 2014, ths. dollars
Table 71. Volumes of Russian export of waffles by countries of destination in 2007-2013, t
Table 72. Volumes of Russian export of waffles by countries of destination in 2007-2012, ths. dollars
Table 73. Export volumes of sweet dry biscuits by months in 2007-March 2013, t
Table 74. Export volumes of sweet dry biscuits by months in 2009-March 2014, ths. dollars
Table 75. Volumes of Russian export of sweet biscuits by countries of destination in 2007-2013, t
Table 76. Volumes of Russian export of sweet biscuits by countries of destination in 2007-2012, ths. dollars
Table 77. Export volumes of ginger biscuits and similar products by months in 2009-March 2014, t
Table 78. Export volumes of ginger biscuits and similar products by months in 2009-March 2013, ths. dollars
Table 79. Volumes of Russian export of ginger biscuits by countries of destination in 2007-2013, t
Table 80. Volumes of Russian export of ginger biscuits by countries of destination in 2007-2013, ths. dollars
Table 81. Average producers’ prices for tortes and cakes in Russia by months in 2008-February 2014, rub/t
Table 82. Average producers’ prices for waffles in Russia by months in 2008-February 2014, rub/t
Table 83. Average producers’ prices for biscuits in Russia by months in 2008-February 2014, rub/
Table 84. Average producers’ prices for pryaniki and ginger cakes in Russia by months in 2008-February 2014, rub/t
Table 85. Average retail prices for biscuits in Russia by months in 2008-February 2014, rub/kg
Table 86. Average retail prices for pryaniki in Russia by months in 2008-February 2014, rub/kg
Table 87. Average retail prices for muffins and rolled cakes in Russia by months in 2008-February 2014, rub/kg
Table 88. Average retail prices for tortes in Russia by months in 2007-February 2014, rub/kg
Table 89. Shareholders of «KDV Yashkino» LLC
Table 90. Subsidiaries of «KDV Yashkino» LLC
Table 91. Production volumes of «KDV Yashkino» LLC
Table 92. Balance sheet of «KDV Yashkino» LLC, ths rubles
Table 93. Profit and loss statement of «KDV Yashkino» LLC, ths rubles
Table 94. Cash-flow statement of «KDV Yashkino» LLC, ths rubles
Table 95. Financials of «KDV Yashkino» LLC
Table 96. Shareholders of “AKKOND” OJSC
Table 97. Subsidiaries of “AKKOND” OJSC
Table 98. Production volumes of “AKKOND” OJSC
Table 99. Balance sheet of «AKKOND », OJSC, ths. rub
Table 100. Profit and loss statement of «AKKOND», OJSC, ths. rub
Table 101. Cash flow statement of «AKKOND», OJSC, ths. rub
Table 102. Financials of «AKKOND»
Table 103. Share holders/founders of “KONTI-RUS” CJSC
Table 104. Subsidiaries of “KONTI-RUS” CJSC
Table 105. Production volumes of “KONTI-RUS”, CJSC ths. rub
Table 106. Balance sheet of “KONTI-RUS”, CJSC ths. rub
Table 107. Profit and loss statement of “KONTI-RUS”, CJSC ths. rub
Table 108. Cash flow statement of “KONTI-RUS”, CJSC , ths. rub
Table 109. Financials of “KONTI-RUS”, CJSC
Table 110. Shareholders/founders of «Chipita Saint Petersburg» LLC
Table 111. Subsidiaries of «Chipita Saint Petersburg» LLC
Table 112. Production volumes of «Chipita Saint Petersburg» LLC
Table 113. Balance sheet «Chipita Saint Petersburg» LLC, ths rubles
Table 114. Profit and loss statement «Chipita Saint Petersburg» LLC, ths rubles
Table 115. Cash-flow statement «Chipita Saint Petersburg» LLC, ths rubles
Table 116. Financials of «Chipita Saint Petersburg» LLC
Table 117. Shareholders of “FILI-BAKER”, LLC
Table 118. Balance sheet of «FILI-BACKER», ths. rub
Table 119. Profit and loss statement of «FILI-BACKER», LLC, ths. rub
Table 120. Financials of «FILI-BACKER», LLC
List of figures
Figure 1. Distribution of volumes of financing of small and medium business support projects from federal and regional budgets by regions on the map of Russia in 2011-2013 , mln. rub
Исследования по теме «Кондитерские и хлебобулочные изделия, мука»
Обзоры по теме «Пищевая промышленность и продовольствие»
все обзоры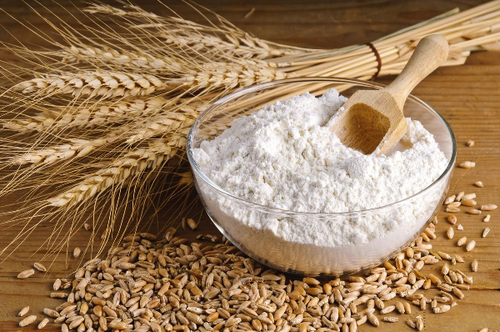
На российском рынке пшеничного крахмала отечественная продукция постепенно вытесняет импорт. Производители модернизируют и расширяют свои заводы, а потребители проявляют все больший интерес к отечественному продукту. Эти процессы влияют на весь рынок: распределение продукции между отраслями, объемы поставок и возможности для экспорта. Компаниям приходится работать в новых условиях и адаптироваться к происходящим изменениям.
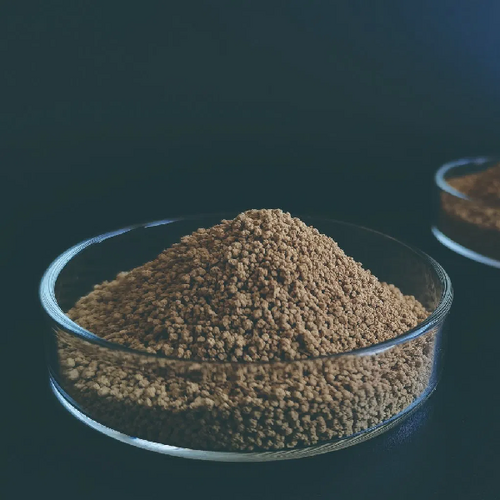
Рынок кормовых аминокислот играет ключевую роль в обеспечении полноценного питания скота, птицы и рыбы, влияя на их рост, продуктивность и здоровье. В настоящее время он в значительной степени зависит от импорта, однако, по оценке наших аналитиков, уже в ближайшие 5–7 лет российское производство не только закрое все внутренние потребности российского рынка, но и обеспечит значительные объемы продукции для экспорта.
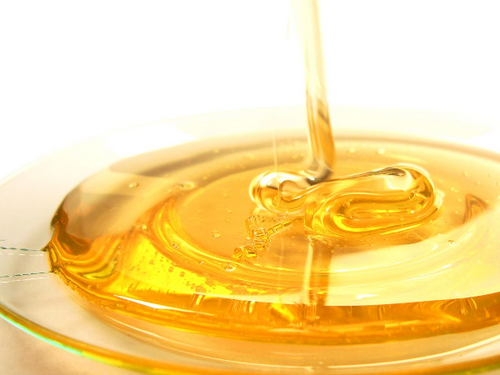
Российский рынок крахмальной патоки в последние годы демонстрирует относительную стабильность как по объемам внутреннего производства, так и по экспорту. С одной стороны, это обеспечивается устойчивым уровнем потребления в пищевой и кормовой промышленности, с другой — налаженными поставками в страны СНГ, где продукт пользуется постоянным спросом.


