Russian meat market. Current situation and forecast
- Дата выхода отчёта: 08 августа 2011 г.
- География исследования: Россия
- Период исследования: 2011 (актуализация по запросу)
- Язык отчёта: Русский и Английский
- Способ предоставления: электронный
-
Описание
-
Содержание
Subject of the research:
RUSSIAN MEAT MARKET
Goal of research:
EVALUATION OF THE RUSSIAN MARKET AND FORECAST OF ITS DEVELOPMENT FOR 2011-2013.
Region of research:
RUSSIA AND REGIONS OF RF
Main blocks of research:
LIVESTOCK IN RUSSIA
VOLUME OF THE RUSSIAN MEAT MARKET
ANALYSIS OF RETAIL SALE OF MEAT
MEAT PRODUCTION (SLAUGHTER WEIGHT) IN RUSSIA
MEAT PRODUCTION (FRESH-KILLED WEIGHT) IN RUSSIA
LARGEST MEAT PRODUCERS OF RUSSIA
ANALYSIS OF RUSSIAN MEAT IMPORT
ANALYSIS OF RUSSIAN MEAT EXPORT
PRODUCER PRICES FOR MEAT IN RUSSIA
RETAIL PRICES FOR MEAT IN RUSSIA
STRUCTURE OF RETAIL PRICES FOR MEAT
RUSSIAN MEAT MARKET TRENDS
STATE REGULATION OF MEAT MARKET
CONSUMER PREFERENCES ON THE RUSSIAN MEAT MARKET
FORECAST OF THE RUSSIAN MEAT MARKET DEVELOPMENT FOR 2011-2013.
Largest Russian companies with profiles:
NOVIY OSKOL SUBSIDIARY OF "PRIOSKOLYE " JSC
"PETELINSKY PZ" LLC
“SVINOKOMPLEKS KOROCHA” JSC
"MYASOKOMBINAT BOBROVSKY" LLC
"MYASOKOMBINAT KLINSKY" JSC
“MPK “PENZENSKY” JSC
“MOS-ET” LLC
"PUSHKINSKY MYASNOY DVOR" LLC
Production volumes, financial activities data, balance sheets, profit and loss statements, cash-flow statements, the subsidiaries and other data about these main companies were presented.
Information sources used:
Federal State Statistics Service
Economic Development Ministry
Federal Customs Service
Federal Tax Service
Field expert evaluations
Retail sale reports
Materials of the field’s main players
Field print and electronic publications
The research contains 124 schedules, 96 diagrams and 112 tables.
EXTRACTS FROM RESEARCH
VOLUME OF RUSSIAN MEAT MARKET
The Russian market of poultry has been dynamically developing during the last 3 years. Major trend for today is ***. Domestic poultry farming is developing rapidly: poultry population and poultry production increase. Rejection of the product in the year 2010 in comparison with 2009, when it held ***% of the total Russian poultry import, did not have a bad influence on the product offer on the Russian domestic market: domestic production in 2010 satisfies more than ***% of the Russian demand. Besides Russia has taken serious steps to the *** development.
Import content on the Russian mutton market in slaughter weight made up ***%. Home-made mutton holds ***% of the Russian market.
In 2010, each beef consuming Russian used in average ***% of this meat. Since 2006, the consumption rose by *** kg.
ANALYSIS OF MEAT RETAILING
Poultry meat retail sales dynamics in 2009 and 2010 is characterized by the same tendency taken quarterly. The highest income from retail sales of poultry meat each year falls on *** quarter. Decay is peculiar for the *** quarter, in the second quarter the retail turnover ***, by the *** quarter it decreases again (by 4% in 2010) and sharply increases in the *** (by 25% in 2010).
In 2010 *** of income from total poultry sales fall on Volga Federal District (*** %). ***% of retail turnover of total sales in monetary equivalent accounts for Central Federal District. *** Federal District share in the Russian demand for poultry meat in money terms makes up 17%.
The highest proceeds from sales of poultry meat in Russia accounts for *** district (21 bln. rub.). Second place is after the Republic of Bashkortostan (*** bln. rub.).
ANALYSIS OF RUSSIAN MEAT IMPORT
The majority of pork, coming from abroad, is frozen. The major categories in import structure by types in 2010 were other frozen pork (*** , other frozen by-products (*** and frozen pork gammons, shoulders and cuts of them (8,1 . Frozen liver and frozen carcasses and half-carcasses account for ***% and 4,3% accordingly.
In 2009 monthly volumes of Russian pork import tended to grow , in January they reached the maximum rate for 2009-2010 – *** tons. At the beginning of 2010 the foreign supplies were decreased to *** tons. In the first six months *** was observed, that was changed by unsteady dynamics in the second half of 2010.
Three main countries that import mutton and goat meat into Russia have the following shares in Russian structure: ***– ***%, New Zealand – ***% …
ANALYSIS OF RUSSIAN MEAT EXPORT
In 2009 there was a big increase of pork export by***% . As per data of 2010 Russia exported to foreign market *** tons of products. In comparison to previous year *** of volume by almost *** is observed.
Half of Russian production cattle meat offered on the foreign market is presented by *** beef. About ***% of the total domestic export makes cattle frozen liver. 3% in the structure of the total supply of Russian beef to other countries makes *** beef. Other by-products account for almost *** Russian beef export.
In value terms mutton export volumes in 2010 were equal to *** thsd. USD, that is almost *** times ***, than was exported in 2009.
Destination countries of Russian export are ***, Azerbaijan, untill 2009 – Denmark.
METHODS OF RESEARCH
LIST OF SCHEDULES, DIAGRAMS, TABLES AND SCHEMES
1. CHARACTERISTICS OF RUSSIAN CONSUMERS
1.1. Dynamics of population
1.2. Social standard of living dynamics
2. SUBJECT OF RESEARCH
2.1. Characteristics of meat
Marking and branding of meat
Technology of meat preparation for storage
Meat storage requirements
2.2. Classifications of meat
Meat classification as per All-Russian Classification of Products
Meat classification as per All-Russian Classification of Products on types of business activities
Meat classification as per Foreign Economic Activity Commodity Nomenclature
Meat classification by animals types
Cattle meat classification by age
Meat classification by sex
Meat classification by fatness
Meat classification by thermal conditions
3. LIVESTOCK IN RUSSIA
3.1. Poultry population
Poultry (in general)
Egg-production chickens
3.2. Pig population
3.3. Cattle population
Cattle (in general)
Cows
3.4. Sheep population
4. VOLUME OF RUSSIAN MEAT MARKET
4.1. Volume of Russian poultry meat market
Dynamics of poultry meat market volume by years
Import content of the poultry meat market content
Dynamics of import content of the poultry meat market
Average consumption of poultry meat
4.2. Volume of Russian pork market
Dynamics of pork market volume by years
Import content of the Russian pork market
Dynamics of import content of the pork market
Consumption of pork in Russia
4.3. Volume of Russian beef market
Dynamics of beef market volume by years
Import content of the beef market
Dynamics of the import content of beef market
Average beef consumption
4.4. Volume of Russian mutton market
Dynamics of mutton market volume by years
Import content of the Russian mutton market
Dynamics of import content of the mutton market
Average mutton consumption
5. ANALYSIS OF MEAT RETAILING
5.1. Analysis of poultry meat retailing
Dynamics of poultry meat retailing by years
Dynamics of poultry meat retailing by quarters
Structure of poultry meat retailing by federal districts of RF
Largest RF regions by poultry meat retail sales
Regional structure of poultry meat retailing
6. MEAT PRODUCTION (SLAUGHTER WEIGHT) IN RUSSIA
6.1. Poultry meat production
Dynamics of poultry meat production volume by years
Dynamics of poultry meat production volume by months
Volumes of poultry meat production in federal districts of RF
Structure of poultry meat production by federal districts of RF
Volumes of poultry meat production in RF regions
Regional structure of poultry meat production
6.2. Pork production
Dynamics of pork production volumes by years
Pork production volumes in federal districts of RF
Structure of pork production by federal districts of RF
Volumes of pork production in RF regions
Regional structure of pork production
6.3. Beef production
Dynamics of beef production volumes by years
Beef production volumes in federal districts of RF
Structure of beef production by federal districts of RF
Volumes of beef production in RF regions
Regional structure of beef production
6.4. Mutton production
Dynamics of mutton production volumes by years
Mutton production volumes in federal districts of RF
Structure of mutton production by federal districts of RF
Volumes of mutton production in RF regions
Regional structure of mutton production
7. MEAT PRODUCTION (FRESH-KILLED WEIGHT) IN RUSSIA
7.1. Poultry meat production
Structure of Russian poultry meat production by types
Dynamics of poultry meat production volumes be years
Dynamics of poultry meat production volumes be months
Volumes of poultry meat production in federal districts of RF
Structure of poultry meat production by federal districts of RF
Volumes of poultry meat production in RF regions
Regional structure of poultry meat production
7.2. Pork production
Dynamics of pork production volumes be years
Dynamics of pork production volumes be months
Volumes of pork production in federal districts of RF
Structure of pork production by federal districts of RF
Volumes of pork production in RF regions
Regional structure of Russian pork production
7.3. Beef production
Dynamics of beef production volumes be years
Dynamics of beef production volumes be months
Volumes of beef production in federal districts of RF
Structure of beef production by federal districts of RF
Volumes of beef production in RF regions
Regional structure of Russian beef production
7.4. Mutton production
Dynamics of mutton production volumes be years
Dynamics of mutton production volumes be months
Volumes of mutton production in federal districts of RF
Structure of mutton production by federal districts of RF
Volumes of mutton production in RF regions
Regional structure of Russian mutton production
8. LARGEST RUSSIAN MEAT PRODUCERS
8.1. Poultry meat (fresh-killed weight)
Volumes of the largest Russian companies production
Structure of production by largest companies
8.2. Pork, Category I
Dynamics of pork production volumes, Category I, by years
Volumes of pork production, Category I, by federal districts of RF
Volumes of pork production, Category I, in regions of RF
Regional structure of Russian pork production, Category I
8.3. Beef, Category I
Dynamics of beef production volumes, Category I, by years
Volumes of beef production, Category I, by federal districts of RF
Regional structure of Russian beef production, Category I
8.4. Mutton (in general)
Volumes of the largest Russian companies production
Structure of production by the largest companies
9. ANALYSIS OF RUSSIAN MEAT IMPORT
9.1. Poultry meat import
Structure of poultry meat import by types
Dynamics of poultry meat import volumes by years
Dynamics of poultry meat import volumes by months
Volumes of poultry meat import from supplying countries
Structure of poultry meat import by supplying countries
9.2. Pork import
Structure of pork import by types
Dynamics of pork import volumes by years
Dynamics of pork import volumes by months
Volumes of pork import from supplying countries
Structure of import by supplying countries
9.3. Beef import
Dynamics of beef import volumes by years
Structure of beef import by types
9.4. Mutton import
Dynamics of mutton import volumes by years
Dynamics of mutton import volumes by months
Volumes of mutton import from supplying countries
Structure of mutton import by supplying countries
10. ANALYSIS OF RUSSIAN MEAT EXPORT
10.1. Poultry meat export
Structure of Russian poultry meat export by types
Dynamics of poultry meat export volumes by years
Dynamics of poultry meat export volumes by months
Volumes of poultry meat export by destination countries
Structure of poultry meat export by destination countries
10.2. Pork export
Dynamics of pork export volumes by years
Structure of pork export by types
10.3. Beef export
Dynamics of beef export volumes by years
Structure of Russian beef export by types
10.4. Mutton export
Dynamics of mutton export volumes by years
11. PRODUCER PRICES FOR MEAT IN RUSSIA
11.1. Comparison of producer prices for various types of meat
11.2. Poultry meat (in general)
Dynamics of producer prices by years
Dynamics of producer prices by months
11.3. Poultry by-products
Dynamics of producer prices for poultry by-products by years
Dynamics of producer prices for poultry by-products by months
11.4. Turkey meat
11.5. Pork
Dynamics of average producer prices for pork by years
Dynamics of average producer prices for pork by months
11.6. Beef
Dynamics of producer prices for beef by years
Dynamics of producer prices for beef by months
11.7. Mutton
Dynamics of average producer prices for mutton by years
Dynamics of average producer prices for mutton by months
12. RETAIL PRICES FOR MEAT IN RUSSIA
12.1. Comparison of average retail prices for various meat types
12.2. Chicken meat (besides chicken legs)
Dynamics of retail prices for chicken meat (besides chicken legs) by years
Dynamics of retail prices for chicken meat (besides chicken legs) by months
12.3. Chicken legs
Dynamics of retail prices for chicken legs by years
Dynamics of retail prices for chicken legs by months
12.4. Pork (boneless)
Dynamics of average retail prices for pork (boneless) by years
Dynamics of average retail prices for pork (boneless) by months
12.5. Pork (besides boneless meat)
Dynamics of average retail prices for pork (besides boneless meat) by years
Dynamics of average retail prices for pork (besides boneless meat) by months
12.6. Beef, boneless
Dynamics of retail prices for boneless beef by years
Dynamics of retail prices for boneless beef by months
12.7. Other beef
Dynamics of retail prices for other beef by years
Dynamics of retail prices for other beef by months
12.8. Beef liver
Dynamics of retail prices for beef liver by years
Dynamics of retail prices for beef liver by months
12.9. Mutton (besides boneless meat)
Dynamics of average retail prices for mutton (besides boneless meat) by years
Dynamics of average retail prices for mutton (besides boneless meat) by months
13. STRUCTURE OF RETAIL PRICE FOR MEAT
13.1. Poultry meat
13.2. Pork (boneless)
13.3. Pork (besides boneless meat)
13.4. Beef (besides boneless meat)
13.5. Boneless beef
14. TRENDS ON THE RUSSIAN MEAT MARKET
14.1. Trends on the meat market (in general)
14.2. Trends on the poultry meat market
14.3. Trends on the pork market
14.4. Trends on the Russian beef market
14.5. Trends on the mutton market
15. STATE REGULATION OF MEAT MARKET
15.1. Poultry meat
15.2. Pork
15.3. Beef
15.4. Mutton
16. CONSUMER PREFERANCES ON THE RUSSIAN MEAT MARKET
16.1. Meat (in general)
16.2. Pork
17. PROFILES OF THE LARGEST MEAT PRODUCING COMPANIES
17.1. Profiles of the largest poultry meat producing companies
Novy Oskol Subsidiary of “Prioskolye” JSC
“Petelinsky PZ” LLC
17.2. Profiles of the largest pork producing companies
“Svinokompleks Korocha” JSC
“Myasokombinat Bobrovsky” LLC
17.3. Profiles of the largest beef producing companies
“Myasokombinat Klinsky” JSC
“MPK “Penzensky” JSC
17.4. Profiles of the largest mutton producing companies
“MOS-ET” LLC
“Pushkinsky myasnoy dvor” LLC
18. FORECAST OF THE RUSSIAN MEAT MARKET DEVELOPMENT FOR 2011-2013.
18.1. Forecast of poultry meat market development
18.2. Forecast of pork market development
18.3. Forecast of beef market development
18.4. Forecast of mutton market development
INFORMATION ABOUT INTESCO RESEARCH GROUP COMPANY
ПРИЛОЖЕНИЕ
List of schedules:
1. Dynamics of resident population number of Russia as of 1 January in 2000-2011, million people.
2. Dynamics of actual household disposable income in Russia by months in 2008-2010, % to previous period
3. Dynamics of average population incomes by months in 2008-2010, % to previous period
4. Dynamics of average population incomes by months in 2008-2010, rub.
5. Dynamics of poultry population in RF in 2006-2010*, ths. heads
6. Dynamics of pigs population in RF in 2008-2010, ths. heads
7. Dynamics of cattle population in RF in 2006-2010, tha. heads
8. Dynamics of cattle population in RF by months in 2008-2009, mln. heads
9. Dynamics of cows population in RF in 2006-2010, ths. heads
10. Dynamics of cows population in Rf by months in 2008-2009, mln. heads
11. Dynamics of sheep and goats population in RF in 2007-2010, ths. heads
12. Dynamics of Russian poultry meat volumes (slaughter weight) in 2007-2010, tons
13. Average consumption of poultry meat in Russia in 2006-2010, kg
14. Dynamics of volume of Russian pork market (slaughter weight) in 2006-2010*, tons
15. Dynamics of pork consumers number in Russia in 2006-2010, mln.peop.
16. Pork consumption in Russia per consumption unit in 2006-2010*, kg/person.
17. Average pork consumption in Russia in 2006-2010*, kg/ person.
18. Dynamics of Russian beef market volume (slaughter weight) in 2006-2010*, tons
19. Average beef consumption in Russia in 2006-2010*, kg/person.
20. Dynamics of Russian mutton market volume in 2006-2010*, tons
21. Average mutton consumption in Russia in 2006-2010*, kg/person.
22. Dynamics of poultry meat retailing in Russia in 2007-2010, mln. rub.
23. Dynamics of poultry meat retailing by quarters in 2007-2010, mln. rub.
24. Largest RF regions by poultry retail sales volumes in 2010, mln. rub.
25. Dynamics of Russian poultry meat production volumes (slaughter weight) in 2006-2011*, ths. tons
26. Dynamics of poultry meat production volumes (slaughter weight) by months in 2010, ths. tons
27. Dynamics of poultry meat production (slaughter weight) in the largest federal districts of RF in 2006-2009, ths. tons
28. Dynamics of poultry meat production (slaughter weight) in main regions of RF in 2006-2009, ths. tons
29. Dynamics of Russian pork production volume (slaughter weight) in physical terms in 2006-2010*, ths. tons
30. Dynamics of prok production (slaughter weight) in largest federal districts of RF in 2006-2009, ths. tons
31. Dynamics of Russian beef production volume (slaughter weight) in 2006-2010*, ths. tons
32. Dynamics of beef production (slaughter weight) in largest federal districts of RF in 2006-2009, ths. tons
33. Dynamics of beef production (slaughter weight) in main regions of RF in 2006-2009, ths. tons
34. Dynamics of Russian mutton production volume (slaughter weight) in physical terms in 2006-2010*, ths. tons
35. Dynamics of mutton production (slaughter weight) in the largest federal districts of RF in 2006-2009, ths. tons
37. Dynamics of Russian production of meat and edible poultry by-products by months in 2010-2011, tons
38. Dynamics of production of meat and edible poultry by-products in the largest federal districts of RF in 2006-2010, tons
39. Dynamics of Russian pork production volume (fresh-killed weight) in physical terms in 2006-2010, tons
40. Dynamics of Russian pork production volume (fresh-killed weight) in money terms in 2006-2010, bln. rub.
41. Dynamics of Russian pork production volume (fresh-killed weight) by months в 2009-2010, tons
42. Dynamics of pork production (fresh-killed weight) in the largest federal districts of RF in 2007-2010, tons
43. The largest regions on pork production (fresh-killed weight) in 2010, tons
44. Dynamics of Russian beef production volume (fresh-killed weight) in 2006-2010*, tons
45. Dynamics of Russian beef production (fresh-killed weight) by months in 2008-2010*, tons
46. Dynamics of beef production (fresh-killed weight) in the largest federal districts of RF in 2006-2009, tons
47. Dynamics of beef production (fresh-killed weight) in main regions of RF in 2006-2009, tons
48. Dynamics of Russian mutton production volume (fresh-killed weight) in physical terms в 2006-2010, tons
49. Dynamics of Russian mutton production volume (fresh-killed weight) by months in 2009-2010, tons
50. Dynamics of mutton production (fresh-killed weight) in the largest federal districts of RF in 2007-2010, tons
51. Dynamics of poultry meat production volume (fresh-killed weight) on the largest RF companies in 2006-2009, tons
52. Dynamics of Russian pork production, Category I (fresh-killed weight) in 2006-2010*, tons
53. Dynamics of Russian beef production volume, Category I (fresh-killed weight) in 2006-2009, tons
54. Dynamics of beef production, Category I (fresh-killed weight) in main regions of RF in 2006-2009, tons
55. Dynamics of the mutton production volumes on the largest RF companies in 2007-2009, tons
56. Dynamics of Russian poultry meat import in 2006-2010, tons
57. Dynamics of Russian poultry meat import in 2006-2010, ths. USD
58. Dynamics of Russian poultry meat import by months in 2007-2011, tons
59. Dynamics of Russian meat import by months in 2007-2011, ths. USD
60. Volumes of the Russian imported poultry meat by largest supplying ountries in 2010, tons
61. Volumes of Russian poultry meat import import by the largest countries of origin in 2010 , ths. USD
62. Dynamics of Russian pork import in 2006-2010*, tons
63. Dynamics of Russian pork import in 2006-2010*, ths. USD
64. Dynamics of Russian pork import volumes by months in 2009-2010, tons
65. Dynamics of Russian pork import by months in 2009-2010, ths. USD
66. Volumes of Russian pork import by largest countries of origin in 2009, tons
67. Volumes of Russian pork import by largest countries of origin in 2009, ths. USD
68. Dynamics of Russian beef import in 2006-2010*, tons
69. Dynamics of Russian beef import in 2006-2010*, ths. USD
70. Dynamics of Russian mutton import in 2006-2010*, tons
71. Dynamics of Russian mutton import in 2006-2010*, ths. USD
72. Dynamics of Russian mutton import volume by months in 2009-2010, tons
73. Dynamics of Russian mutton import by months in 2009-2010, ths. USD
74. Volumes of Russian mutton import by largest countries of origin in 2009 году, tons
75. Volumes of Russian mutton import by largest countries of origin in 2009, ths. USD
76. Dynamics of Russian poultry meat export in 2007-2010, tons
77. Dynamics of Russian poultry meat export in 2007-2010, ths. USD
78. Dynamics of Russian export by months in 2008-2011, tons
79. Dynamics of Russian meat export by months in 2008-2011, ths. USD
80. Volumes of Russian poultry meat export by largest destination countries in 2010, tons
81. Volumes of Russian poultry meat export by largest destination countries in 2010, ths. USD
82. Dynamics of Russian pork export in 2006-2010*, tons
83. Dynamics of Russian pork export in 2006-2010*, ths. USD
84. Dynamics of Russian beef export (in general) in 2006-2010*, tons
85. Dynamics of Russian beef export (in general) in 2006-2010*, ths. USD.
86. Dynamics of Russian mutton export in 2006-2010*, tons
87. Dynamics of Russian mutton export in 2006-2010*, ths. USD.
88. Dynamics of average producer prices for poultry meat in RF in 2007-2010, rub./tons
89. Dynamics of average producer prices for poultry meat in RF by months in 2007-2011, rub./tons
90. Dynamics of average producer prices for poultry by-products in RF in 2007-2010, rub./tons
91. Dynamics of average producer prices for poultry by-products in RF by months in 2009-2011, rub./tons
92. Dynamics of average producer prices for pork in RF in 2007-2010, rub./tons
93. Dynamics of average producer prices for pork in RF by months in 2007-2010, rub./ ton
94. Dynamics of average producer prices for beef in RF in 2007-2010, rub./tons
95. Dynamics of average producer prices for beef in RF by months in 2007-2010, rub./tons
96. Dynamics of average producer prices for mutton in RF in 2007-2010, rub./tons
97. Dynamics of average producer prices for mutton in RF by months in 2007-2011, rub./ tons
98. Dynamics of average retail prices for chicken meat (besides chicken legs) in RF in 2007-2010, rub./kg
99. Dynamics of average retail prices for chicken meat (besides chicken legs) in RF by months in 2007-2011, rub./kg
100. Dynamics of average retail prices for chicken legs in RF in 2007-2010, rub./kg
101. Dynamics of average retail prices for chicken legs in RF by months in 2007-2011, rub./kg
102. Dynamics of average retail prices for pork (boneless) in RF in 2007-2010, rub./kg
103. Dynamics of average retail prices for pork (boneless) by months in 2001-2011, rub./kg
104. Dynamics of average retail prices for pork (besides boneless meat) in RF in 2007-2010, rub./kg
105. Dynamics of average retail prices for pork (besides boneless meat) by months in 2007-2011, rub./ kg
106. Dynamics of average retail prices for boneless beef in RF in 2007-2010, rub./kg
107. Dynamics of average retail prices for boneless beef in RF by months in 2007-2010, rub./kg
108. Dynamics of average retail prices for other beef in RF in 2007-2010, rub./kg
109. Dynamics of average retail prices for other beef in RF by months in 2007-2010, rub./kg
110. Dynamics of average retail prices for beef liver in RF in 2007-2010, rub./kg
111. Dynamics of average retail prices for beef liver in RF by months in 2007-2010, rub./kg
112. Dynamics of average retail prices for mutton (besides boneless meat) in RF in 2007-2010, rub./kg
113. Dynamics of average retail prices for mutton (besides boneless meat)in RF by months in 2007-2011, rub./kg
114. Volumes of state financing into the measurements, aimed at development of sheep breeding and goat breeding in RF in 2008-2012, mln. rub.
115. Rating of the reasons for not consuming pork, %
116. Dynamics of Russian poultry meat market volume (slaughter weight) in 2008-2010 and forecast for 2011-2013, tons
117. Forecast of Russian poultry meat export volume in 2011*-2020*, mln.tons
118. Dynamics of import content on the poultry meat market (slaughter weight) in physical terms in 2008-2013*, %
119. Dynamics of the pork market volume in 2008-2010 and forecast for 2011-2013, tons
120. Dynamics of import content on the pork market in physical terms in 2008-2013*, %
121. Dynamics of Russian beef market volume (slaughter weight) in 2008-2010 and forecast for 2011-2013, tons
122. Dynamics of import content on beef market (slaughter weight) in physical terms in 2008-2013*, %
123. Dynamics of the mutton market in 2008-2010 and forecast for 2011-2013, tons
124. Dynamics of import content on the mutton market in physical terms in 2008-2013*, %
List of diagrams:
1. Structure of poultry population by types of farming in Russia in 2010, %
2. Geography of poultry distribution by federal districts in 2009, %
3. Regional structure of poultry distribution in 2009, %
4. Geography of egg-production chickens distribution by federal districts as of the beginning of 2010, %
5. Geography of egg-production chickens distribution by regions of RF as of the beginning 2010, %
6. Structure of pigs distribution by federal districts in 2010, %
7. Structure of pigs distribution by regions of Rf in 2010, %
8. Structure of cattle distribution by federal regions of RF in 2010, %
9. Structure of cattle distribution by regions of RF in 2010, %
10. Structure of cows distribution by federal districts of RF in 2010, %
11. Structure of cows distribution by regions of RF in 2010, %
12. Structure of sheep and goats population distribution by federal districts in 2010, %
13. Regonal structure of sheep and goats population distribution in 2010, %
14. Import content of Russian poultry meat market (slaughter weight) in physical terms in 2010, %
15. Dynamics of import content on the Russian poultry meat market (slaughter weight) in physical terms in 2006-2010., %
16. Import content of the Russian pork market in physical terms in 2010*, %
17. Dynamics of import content on the Russian pork market in physical terms in 2006-2010*, %
18. Import content of the Russian beef market (slaughter weight) in physical terms in 2010*, %
19. Dynamics of import content of the Russian beeef market (slaughter weight) in physical terms in 2006-2010*, %
20. Import content of the Russian mutton market in physical terms in 2010*, %
21. Dynamics of import content of the Russian mutton market in physical terms in 2006-2010*, %
22. Structure of poultry meat retailing by federal districts of RF in money terms in 2010, %
23. Change of the poultry meat retailing structure by federal districts of RF in money terms in 2009-2010, %
24. Regional structure of poultry meat retailing in 2010 in money terms, %
25. Change of the regional structure of poultry meat retailing in RF in money terms in 2009-2010, %
26. Structure of Russian poultry meat production (slaughter weight) by federal districts in 2010 (Jan-Oct), %
27. Regional structure of Russian poultry meat production (slaughter weight) in 2010 (Jan-Oct), %
28. Structure of Russian pork production (slaughter weight) by federal districts in 2009, %
29. Regional structure of Russian pork production (slaughter weight) in 2009, %
30. Structure of Russian beef production (slaughter weight) by federal districts in 2009, %
31. Change of the Russian beef production structure (slaughter weight) by federal districts in 2006-2009, %
32. Regional structure of Russian beef production (slaughter weight) in 2009, %
33. Change of regional structure of Russian beef production (slaughter weight) in 2006-2009, %
34. Structure of Russian mutton production (slaughter weight) by federal districts in 2009, %
35. Regional structure of Russian mutton production (slaughter weight) in 2009, %
36. Structure of Russian poultry meat production by types in 2009, %
37. Structure of Russian meat and edible by-products of poultry production by federal districts in 2010 году, %
38. Change of Russian meat and edible by-products of poultry production structure by federal districts in 2006-2010, %
39. Regional structure of Russian meat and edible by-products of poultry production in 2010, %
40. Change of regional structure of Russian meat and edible by-products of poultry production in 2007-2010, %
41. Structure of Russian pork production (fresh-killed weight) by federal districts in 2010, %
42. Change of Russian pork production structure (fresh-killed weight) by federal districts of RF in 2006-2010, %
43. Regional structure of Russian pork production (fresh-killed weight) in 2010, %
44. Change of regional structure of Russian pork production (fresh-killed weight) in 2006-2010, %
45. Structure of Russian beef production (fresh-killed weight) by federal districts in 2009, %
46. Change of Russian beef production structure (fresh-killed weight) by federal districts in 2006-2009, %
47. Regional structure of Russian beef production (fresh-killed weight) in 2009, %
48. Change of regional structure of Russian beef production (fresh-killed weight) in 2006-2009, %
49. Structure of Russian mutton production (fresh-killed weight) by federal districts in 2010, %
50. Change of Russian mutton production structure (fresh-killed weight) by federal districts of RF in 2006-2010, %
51. Regional structure of Russian mutton production (fresh-killed weight) in 2010, %
52. Change of regional structure of Russian mutton production (fresh-killed weight) in 2006-2010, %
53. Shares of the largest companies in the structure of the Russian poultry meat production (fresh-killed weight) in 2009, %
54. Structure Russian pork production Category I (fresh-killed weight) by federal districts in 2009, %
55. Regional structure Russian pork production Category I (fresh-killed weight) in 2009, %
56. Regional structure Russian beef production Category I (fresh-killed weight) in 2009, %
57. Shares of the largest companies in the structure of the Russian mutton production in 2009, %
58. Structure of Russian import by types of meat in physical terms in 2010, %
59. Structure of Russian import by types of meat in money terms in 2010, %
60. Structure of Russian poultry meat import by countries of origin in physical terms in 2010, %
61. Change of Russian poultry meat import structure in physical terms by countries in 2007-2010, %
62. Structure of Russian poultry meat import by countries of origin in money terms in 2010, %
63. Structure of Russian pork import by types in physical terms in 2010*, %
64. Structure of Russian pork import by types in money terms in 2010*, %
65. Structure of Russian pork import by countries of origin in physical terms in 2010*, %
66. Structure of Russian pork import by countries of origin in money terms in 2010*, %
67. Structure of Russian beef import by types in physical terms in 2010*, %
68. Structure of Russian beef import by types in money terms in 2010*, %
69. Structure of Russian mutton import by countries of origin in physical terms in 2010*, %
70. Structure of Russian mutton import by countries of origin in money terms in 2010*, %
71. Structure of Russian export by types of meat in physical terms in 2010, %
72. Structure of Russian export by types of meat in money terms in 2010, %
73. Structure of Russian export of chicken parts in 2008-2010 in money terms (without trading with the Republic of Kazakhstan), %
74. Structure of Russian export of chicken parts in 2008-2010 in money terms in Republic of Kazakhstan, %
75. Structure Russian poultry meat export by destination countries in physical terms in 2010, %
76. Structure of Russian poultry meat export by destination countries in money terms in 2010, %
77. Structure Russian pork export by types in physical terms in 2010*, %
78. Structure of Russian pork export by types in money terms in 2010, %
79. Structure of Russian beef export by types in physical terms in 2009, %
80. Structure of Russian beef export by types in money terms in 2009, %
81. Structure of retail price for poultry meat in RF in 2009, rub. per kg
82. Structure of retail price for poultry meat in RF in 2009, in % to retail price
83. Structure of retail price for pork (boneless) in 2009, rub. per kg
84. Structure of retail price for pork (boneless) in 2009, in % to retail price
85. Structure of retail price for pork (besides boneless meat) in 2009, rub. per kg
86. Structure of retail price for pork (besides boneless meat) in 2009, in % to retail price
87. Structure of retail price for beef in RF in 2009, rub. per kg
88. Structure of retail price for beef in RF in 2009, in % to retail price
89. Structure of retail price for boneless beef in RF in 2009, rub. per kg
90. Structure of retail price for boneless beef in RF in 2009, in % to retail price
91. Structure of grain consumption in Russia in 2009, %
92. Structure of chicken meat production volume by types of freezing in Russia in 2010, %
93. Share of meat and fish products in effective biological standard of average meat and fish consumption in Russia in 2011, kg
94. Structure of actual average consumption of meat and meat products in Russia in 2010, %
95. Dynamics of the poultry meat consumption share in Russia in average total consumption in 2010 and 2020, %
96. Share of Russians, consuming pork, %
List of tables:
1. Population of egg-production chickens in federal districts of RF as of the beginning of 2010, ths.heads
2. Population of egg-production chickens in RF regions as of the beginning of 2010, ths.heads
3. Geographical distribution of pigs by federal districts in 2009-2010, ths. heads
4. Geographical distribution of pigs by regions of RF in 2009-2010, ths. heads
5. Geographical distribution of cattle by federal districts of RF in 2006-2010, ths. heads
6. Geographical distribution of cattle by regions of RF in 2006-2010, ths. heads
7. Geographical distribution of cows by Federal districts of RF in 2006-2010, ths. heads
8. Geographical distribution of cows by regions of RF in 2006-2010, ths. heads
9. Geographical distribution of sheep and goats by federal districts in 2007-2010, ths. heads
10. Geographical distribution of sheep and goats by regions of RF in 2007-2010, ths. heads
11. Volumes of poultry meat retailing in federal districts of RF in 2009-2010, ths. rub.
12. Volumes of poultry meat retailing in RF regions in 2009-2010, ths. rub.
13. Volumes of poultry meat production (slaughter weight) in federal districts of RF in 2006-2010, ths. tons
14. Volumes of poultry meat production (slaughter weight) in regions of RF in 2006-2010, ths. tons
15. Pork production volumes (slaughter weight) in federal districts of RF in 2006-2009, ths.tons
16. Pork production volumes (slaughter weight) in RF regions in 2006-2009, ths. tons
17. Beef production volumes (slaughter weight) in federal districts of RF in 2006-2009, ths. tons
18. Volumes of beef production (slaughter weight) in RF regions in 2006-2009, ths. tons
19. Volumes of goat and sheep meat production (slaughter weight) in federal districts of RF in 2006-2009, ths. tons
20. Volumes of sheep and goat meat production (slaughter weight) in RF regions in 2006-2009, ths. tons
21. Volumes of meat and edible by-products of poultry production in federal districts of RF in 2006-2010, tons
22. Volumes of meat and edible by-products of poultry production in RF regions in 2006-2010, tons
23 Pork production volumes (fresh-killed weight) in federal districts of RF in 2006-2010, tons
24. Pork production volumes (fresh-killed weight) in RF regions in 2006-2010, tons
25. Beef production volumes (fresh-killed weight) in federal districts in 2006-2009, tons
26. Beef production volumes (fresh-killed weight) in RF regions in 2006-2009, tons
27. Mutton production volumes (fresh-killed weight) in federal districts of RF in 2006-2010, tons
28. Mutton production volumes (fresh-killed weight) in RF regions in 2006-2010, tons
29. Volumes of poultry meat production (fresh-killed weight) by largest Russian producers in 2006-2009, tons
30. Pork production volumes Category I (fresh-killed weight) by federal districts of RF in 2006-2009, tons
31. Pork production volumes Category I (fresh-killed weight) and by RF regions in 2006-2009, tons
32. Beef production volumes Category I (fresh-killed weight) in RF regions in 2006-2009, tons
33. Mutton production volumes (fresh-killed weight) by largest Russian producers in 2006-2009, tons
34. Volumes of Russian poultry meat import by supplying countries in 2007-2010, tons
35. Volumes of Russian poultry meat import by supplying countries in 2006-2009, ths. USD
36. Volumes of Russian pork import by supplying countries in 2006-2010, tons
37. Volumes of Russian pork import by supplying countries in 2006-2010, ths. USD
38. Volumes of Russian mutton import by supplying countries in 2006-2010, tons
39. Volumes of Russian mutton import by supplying countries in 2006-2010, ths. USD
40. Volumes of Russian poultry meat export by destination countries in 2007-2010, tons
41. Volumes of Russian poultry meat export by destination countries in 2007-2010, ths. USD
42. Average producer prices for poultry meat in RF by months in 2007-2011, rub./tons
43. Average producer prices for poultry by-products in RF by months in 2009-2011, rub./tons
44. Turkey meat and turkey meat products prices in Russia in May, 2011
45. Dynamics of average producer prices for pork in RF by months in 2007-2010, rub./ tons
46. Dynamics of average producer prices for pork in RF by months in 2007-2010, rub./ tons
47. Dynamics of average producer prices for pork in RF by months in 2007-2010, rub./ tons
48. Average retail prices for chicken meat (besides chicken legs) in RF by months in 2007-2011, rub./kg
49. Average retail prices for chicken legs in RF by months in 2007-2011, rub./kg
50. Dynamics of average retail prices for pork (boneless) by months in 2007-2011, rub./ kg
51. . Dynamics of average retail prices for pork (besides boneless meat) by months in 2007-2011, rub./ kg
52. Average retail prices for boneless beef in RF by months in 2007-2011, rub./kg
53. Average retail prices for other beef in RF by months in 2007-2011, rub./kg
54. Average retail prices for beef liver in RF by months in 2007-2011, rub./kg
55. Dynamics of average retail prices for mutton (besides boneless meat)by months in 2007-2011, rub./kg
56. Structure of retail price for poultry meat in RF in 2009
57. Structure of retail price for pork (boneless) in RF in 2009
58. Structure of retail price for pork (besides boneless meat) in RF in 2009
59. Structure of retail price for beef (besides boneless meat) in RF in 2009
60. Structure of retail price for boneless beef in RF in 2009
61. Goods production volumes of Novy Oskol subsidiary of «Prioskolye» JSC
62. Number of personnel of «Petelinsky PZ» LLC, people
63. Shareholders of «Petelinsky PZ» LLC
64. Production volumes of «Petelinsky» LLC
65. Balance sheet of «Petelinsky PZ» LLC,ths. rub.
66. Profit and loss statement of «Petelinsky PZ» LLC, ths.rub.
67. Cashflow statement of «Petelinsky PZ» LLC, ths.rub.
68. Dynamics of financials of «Petelinsky PZ» LLC
69. Number of personnel of «SVINOKOMPLEKS KOROCHA», people
70. Shareholders of «SVINOKOMPLEKS KOROCHA» JSC
71. Goods production volumes «SVINOKOMPLEKS KOROCHA» JSC
72. Balance sheet of «SVINOKOMPLEKS KOROCHA» JSC, ths.rub.
73. . Profit and loss statement of «SVINOKOMPLEKS KOROCHA» JSC , ths.rub.
74. Cash-flow statement of «SVINOKOMPLEKS KOROCHA» JSC , ths.rub.
75. Dynamics of financials of «SVINOKOMPLEKS KOROCHA» JSC
76. Number of personnel of «MYASOKOMBINAT BOBROVSKY» LLC , peop
77. Shareholders of «MYASOKOMBINAT BOBROVSKY» LLC
78. Goods production volumes of «MYASOKOMBINAT BOBROVSKY» LLC
79. Balance sheet of «MYASOKOMBINAT BOBROVSKY» LLC, ths.rub.
80. Profit and loss statement of «MYASOKOMBINAT BOBROVSKY» LLC , ths.rub.
81. Cash-flow statement of «MYASOKOMBINAT BOBROVSKY» LLC , ths.rub.
82. Dynamics of financials of «MYASOKOMBINAT BOBROVSKY» LLC
83. Number of personnel of «Myasokombinat Klinsky» JSC , peop.
84. Shareholders of «Myasokombinat Klinsky» JSC
85. Subsidiary of «Myasokombinat Klinsky» JSC
86. Goods production volumes of «Myasokombinat Klinsky» JSC
87. Balance sheet of «Myasokombinat Klinsky» JSC, ths.rub.
88. Cash-flow statement of «Myasokombinat Klinsky» JSC , ths.rub..
90. Dynamics of financials of «Myasokombinat Klinsky» JSC
91. Number of personnel of «MPK «Penzensky» JSC, people
92. Shareholders of «MPK «Penzensky» JSC
93. Subsidiaries of «MPK «Penzensky» JSC
94. Goods production volumes of «MPK «Penzensky» JSC
95. Balance sheet of «MNK «Penzensky» JSC, ths.rub.
96. Profit and loss statement of «MPK «Penzensky» JSC, ths.rub.
97. Cash-flow statement of «MPK «Penzensky» JSC, ths.rub.
98. Dynamics of financials of «MPK «Penzensky» JSC
99. Number of personnel of «MOS-ET» LLC, people
100. Shareholders of «MOS-ET» LLC
101. Goods production volumes of «MOS-ET» LLC
102. Balance sheet of «MOS-ET» LLC, ths.rub.
103. Profit and loss statement of «MOS-ET» LLC, ths.rub.
104. Cash-flow statement of «MOS-ET» LLC, ths.rub.
105. Dynamics of financials of «MOS-ET» LLC
106. Number of personnel of «PUSHKINSKY MYASNOY DVOR» LLC, peop.
107. Shareholders of «PUSHKINSKY MYASNOY DVOR» LLC
108. Goods production volumes «PUSHKINSKY MYASNOY DVOR» LLC
109. Balance sheet «PUSHKINSKY MYASNOY DVOR» LLC, ths.rub.
110. Profit and loss statement of «PUSHKINSKY MYASNOY DVOR» LLC, ths.rub..
111. Cash-flow statement of «PUSHKINSKY MYASNOY DVOR» LLC, ths.rub.
112. Dynamics of financials of «PUSHKINSKY MYASNOY DVOR» LLC.
Исследования по теме «Мясо и мясные изделия»
Обзоры по теме «Пищевая промышленность и продовольствие»
все обзоры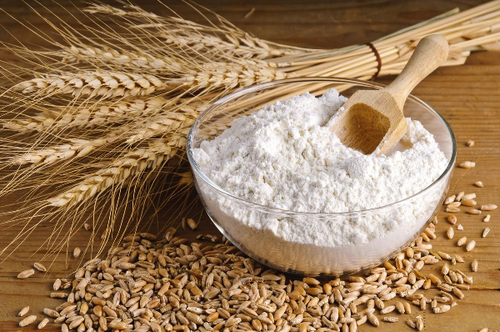
На российском рынке пшеничного крахмала отечественная продукция постепенно вытесняет импорт. Производители модернизируют и расширяют свои заводы, а потребители проявляют все больший интерес к отечественному продукту. Эти процессы влияют на весь рынок: распределение продукции между отраслями, объемы поставок и возможности для экспорта. Компаниям приходится работать в новых условиях и адаптироваться к происходящим изменениям.
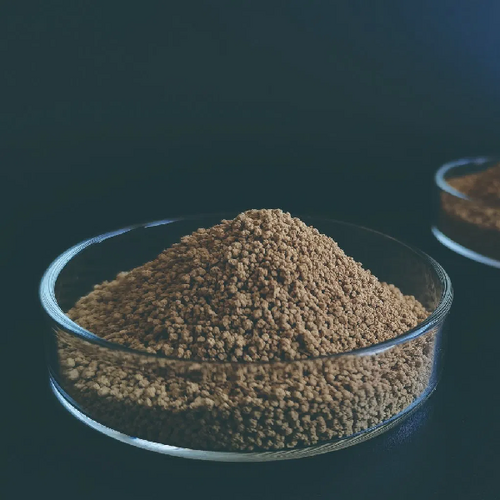
Рынок кормовых аминокислот играет ключевую роль в обеспечении полноценного питания скота, птицы и рыбы, влияя на их рост, продуктивность и здоровье. В настоящее время он в значительной степени зависит от импорта, однако, по оценке наших аналитиков, уже в ближайшие 5–7 лет российское производство не только закрое все внутренние потребности российского рынка, но и обеспечит значительные объемы продукции для экспорта.
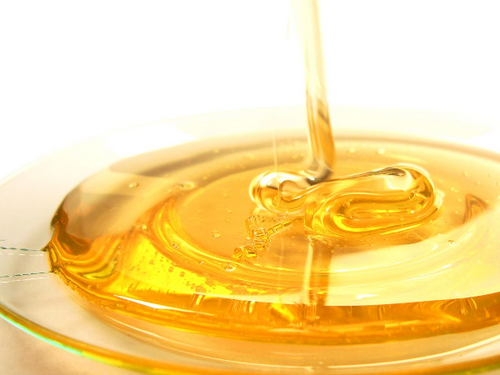
Российский рынок крахмальной патоки в последние годы демонстрирует относительную стабильность как по объемам внутреннего производства, так и по экспорту. С одной стороны, это обеспечивается устойчивым уровнем потребления в пищевой и кормовой промышленности, с другой — налаженными поставками в страны СНГ, где продукт пользуется постоянным спросом.


