Sauces and Russian sauces market - 2013
- Дата выхода отчёта: 13 июня 2013 г.
- География исследования: Россия
- Период исследования: актуализация по запросу
- Язык отчёта: Русский
- Способ предоставления: электронный
-
Описание
-
Содержание
Subject of research: MARKET OF SAUCES
Goal of research:EVALUATION OF THE MARKET AND FORECAST OF ITS DEVELOPMENT
Regions of research:
RUSSIA
RF REGIONS
Main blocks of research:
VOLUME OF THE RUSSIAN SAUCES MARKET
TRENDS ON THE RUSSIAN MARKET OF SAUCES
FACTORS INFLUENCING MARKET OF SAUCES
SALES CHANNELS ON THE MARKET OF SAUCES
LARGEST PLAYERS ON THE MARKET OF SAUCES
PRODUCTION OF SAUCES IN RUSSIA
LARGEST RUSSIAN PRODUCERS OF SAUCES
ANALYSIS OF RUSSIAN SAUCES IMPORT AND INGREDIENTS FOR THEIR PRODUCTION
ANALYSIS OF RUSSIAN SAUCES EXPORT AND INGREDIENTS FOR THEIR PRODUCTION
PRODUCER PRICES FOR SAUCES IN RUSSIA
RETAIL PRICES FOR SAUCES IN RUSSIA
CONSUMER PREFERENCES ON THE MARKET OF SAUCES
FORECAST OF THE RUSSIAN MARKET DEVELOPMENT
Types of sauces researched:
MAYONNAISE
KETCHUP AND TOMATO SAUCE
MUSTARD
SOY SAUCE
SOUR CREAM
The larges Russian enterprises with profiles:
«ESSEN PRODUCTION AG» JSC
«EFKO» JSC
«NZHMK» JSC
«UNILEVER RUS» LLC
«KAZANSKIY ZHIROVOY KOMBINAT» JSC
The research includes the main enterprises’ production volumes, financial performance of activities, balance sheets, profit-and-loss reports, cash-flow statements, subsidiary enterprises and other information.
Information sources used:
Federal State Statistics Service
Ministry of Economic Development
Federal Customs Service
Federal Tax Service
Field expert evaluations
Retail sales reports
Materials of the field’s main players
Field printed and electronic publications
The research contains 80 schedules, 40 diagrams, 106 tables and 1 scheme.
EXTRACTS FROM RESEARCH
SAUCES PRODUCTION IN RUSSIA
In 2012 volume of the Russian sour cream production amounted to ***,85 ths tons, that was almost **% more than in the previous year.
Russian production of sour cream in 2009-2012 was characterized by seasonality. Thus, the peak of this good production is marked in April-July, and then production decreases till September.
The largest part in the structure of the Russian sour cream production belongs to semifat sour cream (15-34%). In 2010 it had 93,7%. **% belong to low-fat sour cream (10-14%). A small share belongs to fat sour cream (over 35%) – **% in 2012. Since 2010 the share of the segment decreased by 0,16 %.
Thus, popularity of high calorie products decreases annually, along with the growth of the share of relatively low fat content sour cream.
ANALYSIS OF RUSSIAN SAUCES IMPORT
Dynamics of the Russian import of ready-to-eat sauces and ingredients for their production is unstable. Thus, in 2010 growth of volumes of foreign supplies was marked. However in 2011 this parameter decreased by 2% to **7,2 ths tons. In 2012 it decreased by 0,5% and amounted to **6,7 ths tons.
In 2012 about 23% of all Russian import belonged to ketchup and tomato paste. Almost one fifth belonged to soy sauce –19,8%. Mustard and mustard powder in 2012 had almost 4% of all Russian sauces import in physical terms. The largest part of imported ready-to-eat sauces and ingredients for their production was represented by other types of sauces.
In 2012 about **,7 ths tons of all ready-to-eat sauces and ingredients for their production were supplied from the territory of Republic of Korea. 3,3 ths tons less belonged to import of these products from Netherlands – 14,4 ths tons. Volumes of supplies from Vietnam and Ukraine in 2012 amounted to**,61 ths tons and 11,56 ths tons respectively.
It should be marked that supplies from Korea and Netherlands in 2012 decreased – by 11% (or 2,3 ths tons) and by 14% (or 2,4 ths tons) respectively. At the same time import from Vietnam and Ukraine increased by 7% and 4%.
In 2012 volume of supplies of ready-to-eat sauces and ingredients for their production from China and Estonia increased significantly.
ANALYSIS OF RUSSIAN SAUCES EXPORT
Profits from sales of Russian mustard on the external market exceeded *** mln dollars. It was 1%, than proceeds of 2011. It should be mentioned that in 2010-2011 export parameters in cost terms were equal - *** ths dollars, although in physical terms parameters decreased.
Export of ready-to-eat mustard and mustard powder from Russia is characterized by pronounced seasonal fluctuations: in the middle of the year volumes of supplies decrease. Such a dynamics was due to the decrease of this good production in summer months, caused by some decrease of consumption.
The largest part of export of ready-to-eat mustard and mustard powder belongs to Kazakhstan. In 2012 supplies to this country amounted to *** tons. USA ranked second with the parameter of *58 tons, Lithuania - third, markets of which consumed *32 tons of goods produced in Russia. Compared to 2011 export of mustard to the market of USA increased 6 times, Lithuanian market – 53%, at the same time the largest importer of domestic mustard – Kazakhstan – decreased consumption volume by 32%.
RESEARCH METHODOLOGY. LIST OF SCHEDULES, DIAGRAMS, TABLES AND SCHEMES
GENERAL ECONOMIC SITUATION IN RUSSIA
1.1. Population of Russia
Population number
Largest citiec
Population’s standard of living
E conomic activity
1.2. Economic situation
Dynamics of economy development
Stability of state budget
1.3. Position of Russia in the world
RF share in the world population
2. SUBJECT OF RESEARCH
2.1. Sauces
2.2. Mayonnaise
2.3. Ketchup and tomato sauce
2.4. Mustard
2.5. Soy sauce
3. VOLUME OF RUSSIAN SAUCES MARKET
3.1. Sauces (in general)
Segmentation of sauces market
3.2. Mayonnaise
Dynamics of the market volume
Import content on the Russian marke
Consumption of mayonnaise in Russia
3.3. Ketchup and tomato sauce
Dynamics of the market volume
Import content on the Russian market
Consumption of ketchup in Russia
3.4. Soy sauce
Dynamics of the market volume
Import content on the market
Segmentation of the Russian market by the largest companies
3.5. Mustard
Dynamics of the market volume
Import content on the market
4. TRENDS ON THE RUSSIAN MARKET OF SAUCE
4.1. Development of sauces consumption structure
4.2. New products on the market sauces and dressings
4.3. Trends on the market of sauces packing
4.4. Foreign and Russian companies
4.5. Strengthening of large companies position
5. FACTORS INFLUENCING MARKET OF SAUCES
5.1. Economic and political factors
5.2. S ocial factors
5.3. Competition on the market
5.4. Seasonality impact
6. SALES CHANNELS ON THE MARKET OF SAUCES
7. LARGEST PLAYERS ON THE MARKET OF SAUCES
7.1 Structure of the market by players
7.2 Heinz
7.3 Unilever
7.4. Essen Production
7.5. Efko
8. SAUCES PRODUCTION IN RUSSIA
8.1. Mayonnaise
Production dynamics by years
Production dynamics by months
Production volume by federal districts
Production volume by regions
8.2. Sour cream
Dynamics of Russian production by years
Dynamics of Russian production by months
Production structure by fatness
Production volume by federal districts
Production volume by regions
8.3. Ketchup and tomato sauce
Dynamics of Russian production by years
Dynamics of Russian production by months
Production volume by federal districts
Production volume by regions
8.4. Ready-to-eat mustard
Dynamics of production volume by years
Dynamics of production volume by months
Production volume by federal districts of RF
Production volume in regions of RF
8.5. Soy sauce
Dynamics of production volume by years
Dynamics of production volumes by months
Production structure by regions and federal districts
9. LARGEST RUSSIAN PRODUCERS OF SAUCES
9.1. Mayonnaise (up to 2009)
Production volume of the largest Russian enterprises
Structure of production by largest enterprises
9.2. Sour cream (up to 2009)
Production volume of the largest Russian enterprises
Structure of production by largest enterprises
9.3. Ketchup and tomato sauce (up to 2009)
Production volume of the largest Russian enterprises
Structure of production by largest Russian enterprises
9.4. Mustard (up to 2009)
Production volume of the largest Russian enterprises
Structure of production by largest enterprises
9.5. By total revenues volume (up to 2011)
Production of spices and seasonings
10. ANALYSIS OF RUSSIAN SAUCES IMPORT
10.1. Ready-to-eat sauces and products for sauces production
Dynamics of import volume by years
Import structure by types
Import by supplying countries in physical terms
Import by supplying countries in cost terms
10.2. Ketchup and tomato sauce
Dynamics of import volume by years
Dynamics of import volume by months
Import volume by countries of origin
Import structure by countries of origin
10.3. Soy sauce
Dynamics of import volume by years
Dynamics of import volume by months
Import volumes by supplying countries
Import structure by supplying countries
Largest supplying countries of soy sauce
10.4. Mustard
Dynamics of import volume by years
Dynamics of import volume by months
Import volumes by supplying countries
Import structure by supplying countries
11. ANALYSIS OF RUSSIAN SAUCES EXPORT
11.1. Ready-to-eat sauces and products for sauces production
Dynamics of export volumes by years
Export structure by types
Export by countries of destination in physical terms
Export by countries of destination in cost terms
11.2. Ketchup and tomato sauce
Dynamics of export volumes by years
Dynamics of export volume by months
Export volume by countries of destination
Export structure by countries of destination
11.3. Soy sauce
Dynamics of export volumes by years
Dynamics of export volume by months
Export volumes by countries of destination
Export structure by countries of destination
11.4. Mustard
Dynamics of export volumes by years
Dynamics of export volume by months
Export volumes by countries of destination
Export structure by countries of destination
12. PRODUCER PRICES FOR SAUCES IN RUSSIA
12.1. Mayonnaise
Dynamics of producer prices by years
Dynamics of producer prices by months
12.2. Sour cream
Dynamics of producer prices by years
Dynamics of producer prices by months
12.3. Ketchup and tomato sauce
Dynamics of producer prices by years
Dynamics of producer prices by months
12.4. Mustard
Dynamics of producer prices by months
13. RETAIL PRICE FOR SAUCES
13.1. Mayonnaise
Dynamics of retail prices by years
Dynamics of retail prices by months
13.2. Sour cream
Dynamics of retail prices by years
Dynamics of retail prices by months
13.3. Ketchup and tomato sauce
Dynamics of retail prices by years
Dynamics of retail prices by months
14. CONSUMER PREFERENCES ON THE MARKET OF SAUCES
14.1. Sauces
14.2. Mayonnaise
14.3. Ketchup and tomato sauce
15. PROFILES OF THE LARGEST COMPANIES PRODUCING SAUCES
15.1. «ESSEN PRODUCTION AG» JSC
Reference information
Types of activity
Production volumes
Balance sheet
Profit and loss statement
Cash flow statement
Financials of activity
15.3 «EFKO» JSC
Reference information
Types of activity
Production volumes
Balance sheet
Profit and loss statement
Cash flow statement
Financials of activity
15.2. «NZHMK» JSC
Reference information
Types of activity
Production volumes
Balance sheet
Profit and loss statement
Cash flow statement
Financials of activity
15.4. «UNILEVER RUS» LLC
Reference information
Types of activity
Production volumes
Balance sheet
Profit and loss statement
Cash flow statement
Financials of activity
15.5. «KAZANSKIY ZHIROVOY KOMBINAT» JSC
Reference information
Types of activity
Production volumes
Balance sheet
Profit and loss statemen t
Cash flow statement
Financials of activity
16. FORECAST OF SAUCES MARKET DEVELOPMENT
ABOUT INTESCO RESEARCH GROUP
List of schedules
1. Dynamics of resident population number of Russia in 2000, 2005, 2010 and forecast for 2015 and 2020, ths people
2. Dynamics of actual household disposable income in Russia in 2000-2010, %
3. Forecast of the ratio of demographic load dynamics in 2011-2033
4. Dynamics of number of employed and unemployed people in RF in 2006-2010, ths people
5. Dynamics of share of the unemployed in economically active population by FD of RF in 2006-2010, %
6. Dynamics of GDP of RF in prices of 2008 in2001-2011, billion rubles
7. Investments into the fixed capital of RF in 2001-2010
8. Surplus/deficit of consolidated budget of RF in 2006-2010, %
9. Dynamics of total external debt of RF in 2001-2010
10. Dynamics of the Russian external debt structure by the main sectors in 2001-2010, %
11. Consumer prices index in RF in 2001-2010, %
12. Share of RF in the population of the world in 2000-2010 and forecast until 2100
13. Dynamics of the Russian mayonnaise market in physical terms in 2009-2012 , ths tons
14. Dynamics of the Russian mayonnaise market in cost terms in 2009-2012, billion rubles
15. Per capita consumption of mayonnaise in Russia in 2007-2010, kg/person
16. Dynamics of the Russian ketchup and tomato sauces market in 2009-2012 , ths tons
17. Dynamics of the Russian ketchup and tomato sauces market in cost terms in 2009-2012, billion rubles
18. Per capita consumption of ketchup and tomato sauces in Russia in 2009-2012, kg/person
19. Dynamics of the Russian soy sauce market in physical terms in 2009-2012, tons
20. Dynamics of the Russian soy sauce market in cost terms in 2009-2012, billion rubles
21. Dynamics of the Russian mustard market in physical terms in 2009-2012, tons
22. Dynamics of the Russian mustard market in cost terms in 2009-2012, billion rubles
23. Dynamics of the Russian mayonnaise production volume in 2009-2012, tons
24. Dynamics of Russian mayonnaise production by months in 2009- March 2013, tons
25. Dynamics of the Russian sour cream production in 2009-2012, tons
26. Dynamics of Russian sour cream production by months in 2009-March 2013, tons
27. Dynamics of the Russian volume of ketchup and other tomato sauces production in 2009-2012, ths cond cans
28. Dynamics of Russian production of ketchup and other tomato sauces by months in 2009-March 2013, ths cond cans
29. Dynamics of the Russian ready-to-eat production volume in 2009-2012, tons
30. Dynamics of the Russian ready-to-eat mustard production volume by months in 2009-March 2013, tons
31. Dynamics of the Russian soy sauce production volume in 2009-2012, ths cond cans
32. Dynamics of Russian soy sauce production by months in 2009-March 2013, ths cond cans
33. Dynamics of mayonnaise production volume by the largest enterprises of RF in 2006-2009, tons
34. Dynamics of production volumes of sour cream on the largest enterprises of RF in 2006-2009, tons
35. Dynamics of production volume of ketchup and tomato sauces on the largest enterprises of RF in 2007-2009, ths cond cans
36. Dynamics of production volumes of ready-to-eat mustard on the largest enterprises of RF in 2006-2009, tons
37. Dynamics of the volume of Russian import of ready-to-eat sauces and ingredients for their production in physical terms in 2009-2012, tons
38. Dynamics of the volume of Russian import of ready-to-eat sauces and ingredients for their production in cost terms in 2009-2012, ths dollars
39. Dynamics of the Russian import of ketchup and other tomato sauces in 2009-2012, tons
40. Dynamics of the Russian import of ketchup and other tomato sauces in cost terms in 2009-2012, ths dollars
41. Dynamics of the Russian import of ketchup and other tomato sauces by months in physical terms in 2009-2012, tons
42. Dynamics of the Russian import of ketchup and other tomato sauces by months in cost terms in 2009-2012, ths dollars
43. Dynamics of the Russian import of soy sauce in physical terms in 2009-2012, tons
44. Dynamics of the Russian import of soy sauce in cost terms in 2009-2012, ths dollars
45. Dynamics of the Russian import of soy sauce by months in physical terms in 2009-2012, tons
46. Dynamics of the Russian import of soy sauce by months in cost terms in 2009-2012, ths dollars
47. Dynamics of the Russian import of mustard in physical terms in 2009-2012, tons
48. Dynamics of the Russian import of mustard in cost terms in 2009-2012, ths dollars
49. Dynamics of the Russian import of mustard by months in physical terms in 2009-2012, tons
50. Dynamics of the Russian import of mustard by months in cost terms in 2009-2012, ths dollars
51. Dynamics of the Russian export of ready-to-eat sauces and ingredients for their production in 2009-2012, tons
52. Dynamics of the Russian export of ready-to-eat sauces and ingredients for their production in 2009-2012, ths dollars
53. Dynamics of the Russian export of tomato ketchup in 2009-2012, tons
54. Dynamics of the Russian export of tomato ketchup in 2009-2012, ths dollars
55. Dynamics of the Russian export of tomato ketchup by months in 2009- 2012, tons
56. Dynamics of the Russian export of tomato ketchup by months in 2009-2012, ths dollars
57. Dynamics of the Russian export of soy sauce in 2009-2012, tons
58. Dynamics of the Russian export of soy sauce in 2009-2012, ths dollars
59. Dynamics of the Russian export of soy sauce by months in 2009-2012, tons
60. Dynamics of the Russian export of soy sauce by months in 2009- 2012, ths dollars
61. Dynamics of the Russian export of mustard in 2009-2012, tons
62. Dynamics of the Russian export of mustard in 2009-2012, ths dollars
63. Dynamics of the Russian export of mustard by months in 2009-2012, tons
64. Dynamics of the Russian export of mustard by months in 2009-2012, ths dollars
65. Dynamics of average producer prices for mayonnaise in RF in 2007-2012, rub/ton
66. Dynamics of average producer prices for mayonnaise in RF by months in 2010- January 2013, rub/ton
67. Dynamics of average producer prices for sour cream in RF in 2007-2012, rub/ton
68. Dynamics of average producer prices for sour cream in RF by months in 2010-2012 , rub/ton
69. Dynamics of average producer prices for ketchup in RF in 2010-2012 , rub/ton
70. Dynamics of average producer prices for ketchup in RF by months in 2010-2012 , rub/ton
71. Dynamics of average retail prices for mayonnaise in RF in 2007-2012, rub/kg
72. Dynamics of average retail prices for mayonnaise in RF by months in 2009-April 2013, rub/kg
73. Dynamics of average retail prices for sour cream in RF in 2007-2012, rub/kg
74. Dynamics of average retail prices for sour cream in RF by months in 2009-April 2013, rub/kg
75. Dynamics of average retail prices for ketchup in RF in 2007-2012, rub/kg
76. Dynamics of average retail prices for ketchup in RF by months in 2009-April 2013, rub/kg
77. Share of consumers of mayonnaise, ketchup and ready-to-eat sauces in RF in 2000 and 2012, %
78. Consumer preferences on the market of sauces in 2010 and 2012, %
79. Dishes, while cooking of which ketchup and tomato sauce is used , %
80. Dishes , to which respondents add ketchup and tomato sauce after cooking , %
List of diagrams
1. Structure of the Russian population number compared to the working age in 2011-2031, % ( medium variant of forecast )
2. Dynamics of the number of employed an dunemployed peole in Russia in 2000-2012 and forecast for 2013-2015, mln people
3. Change of structure of RF external debt in 2009-2013 ( as of January 1 ), %
4. Structure of the Russian market of sauces by types in 2011-2012*, %
5. Dynamics of import content on the Russian market of mayonnaise in physical terms in 2009-2012, %
6. Dynamics of import content on the Russian market ketchup and tomato sauces in physical terms in 2009-2012, %
7. Dynamics of import content on the Russian market of soy sauce in physical terms in 2009-2012, %
8. Structure of the Russian market of soy sauce by the largest companies in 2011-2012, %
9. Dynamics of import content on the Russian market mustard in physical terms in 2009-2012, %
10. Structure of the Russian market of sauces and seasonings by the largest players in 2012, %
11. Structure of the Russian production of sour cream by fatness in physical terms in 2009-2012, %
12. Structure of the Russian production soy sauce by federal districts and regions in 2012, %
13. Shares of the largest enterprises in the structure of all-Russian mayonnaise production in 2009, %
14. Structure of mayonnaise production by the largest producers in 2011, %
15. Shares of the largest enterprises in all-Russian structure of sour cream production in 2009, %
16. Shares of the largest enterprises in all-Russian structure of ketchup and tomato sauces production in 2009, %
17. Shares of the largest enterprises in all-Russian structure of ready-to-eat mustard production in 2009, %
18. Import structure of ready-to-eat sauces and ingredients for their production by types in physical terms in 2012, %
19. Import structure of ready-to-eat sauces and ingredients for their production by types in cost terms in 2012, %
20. Structure of the Russian import of ketchup and other tomato sauces by countries of origin in physical terms in 2012, %
21. Change of structure of the Russian import of ketchup and other tomato sauces in physical terms in 2009-2012, %
22. Structure of the Russian import of ketchup and other tomato sauces by countries of origin in cost terms in 2012, %
23. Change of structure of the Russian import of ketchup and other tomato sauces in cost terms in 2009-2012, %
24. Structure of the Russian import of soy sauce by countries of origin in physical terms in 2012, %
25. Change of structure of the Russian import of soy sauce in physical terms in 2009-2012, %
26. Structure of the Russian import of soy sauce by countries of origin in cost terms in 2012, %
27. Change of structure of the Russian import of soy sauce in cost terms in 2009-2012, %
28. Structure of the Russian import of mustard by countries of origin in physical terms in 2012, %
29. Change of structure of the Russian import of mustard in physical terms in 2009-2012, %
30. Structure of the Russian import of mustard by countries of origin in cost terms in 2012, %
31. Change of structure of the Russian import of mustard in cost terms in 2009-2012, %
32. Export structure of ready-to-eat sauces and ingredients for their production by types in physical terms in 2012, %
33. Export structure of ready-to-eat sauces and ingredients for their production by types in cost terms in 2012, %
34. Structure of the Russian export of ready-to-eat sauces and ingredients for their production by countries of destination in physical terms in 2012, %
35. Structure of the Russian export of ready-to-eat sauces and ingredients for their production by countries of destination in cost terms in 2012, %
36. Structure of the Russian export of tomato ketchup by countries of destination in physical terms in 2012, %
37. Structure of the Russian export of tomato ketchup by countries of destination in cost terms in 2012, %
38. Structure of the Russian export of soy sauce by countries of destination in physical terms in 2012, %
39. Structure of the Russian export of soy sauce by countries of destination in cost terms in 2012, %
40. Structure of mayonnaise consumption by the degree of fatness in 2004-2010, %
List of tables
1. Population number of the largest cities of Russia according to Russian general census of 2010, ths. peop le
2. Largest companies on the market of soy sauce in RF in physical terms in 2011
3. Largest companies on the market of soy sauce in RF in physical terms in 2012, tons
4. Volume of the Russian mayonnaise production in 2009-March 2013, tons
5. Volume of the Russian mayonnaise production by federal districts in 2009-March 2013, tons
6. Volume of the Russian mayonnaise production in regions of RF in 2009-March 2013, tons
7. Volume of the Russian sour cream production by months in 2009-March 2013, tons
8. Volume of the Russian sour cream production by months in 2009-March 2013, tons
9. Volume of the Russian sour cream production by regions in 2009-March 2013, tons
10. Production volumes of the Russian ketchup and other tomato sauces by months in 2009-March 2013, ths cond cans
11. Dynamics of Russian production of ketchup and other tomato sauces in 2009-March 2013, ths cond cans
12. Production volumes of the Russian ketchup and other tomato sauces in 2009-March 2013, ths cond cans
13. Production dynamics of mustard powder in RF in 2009-2012, tons
14. Volume of the Russian ready-to-eat mustard production by months in 2009-March 2013, tons
15. Volume of the Russian ready-to-eat mustard production by federal districts in 2009-March 2013, tons
16. Production volumes of ready-to-eat mustard by regions in 2009-March 2013, tons
17. Production volumes of the Russian soy sauce by months in 2009-March 2013, ths cond cans
18. Production volumes of the Russian soy sauce by subjects of RF in 2009-March 2013, ths cond cans
19. Mayonnaise production volume by the largest Russian producers in 2006-2009, tons
20. Production volume of sour cream at the largest Russian enterprises in 2006-2009, tons
21. Largest producers and volumes of ketchup and tomato sauces production in Russia, ths cond. cans
22. Production volume of ready-to-eat mustard by the largest Russian producers in 2006-2009, tons
23. The largest Russian producers of spices and seasonings by the volume of revenues in 2008-2011, ths rubles
24. Volumes of the Russian import of sauces by types in 2009-2012, tons
25. Cost of the Russian sauces import by types in 2009-2012 , ths dollars
26. Volume of the Russian import of ready-to-eat sauces and ingredients for their production by supplying countries in physical terms in 2009- January 2013, tons
27. Volume of the Russian import of ready-to-eat sauces and ingredients for their production by supplying countries in cost terms in 2009-January 2013, ths dollars
28. Volumes of the Russian import of ketchup and other tomato sauces by months in physical terms in 2009-January 2013, tons
29. Volumes of the Russian import of ketchup and other tomato sauces by months in cost terms in 2009-January 2013, ths dollars
30. Volumes of the Russian import of ketchup and other tomato sauces by countries of origin in physical terms in 2009-January 2013, tons
31. Volumes of the Russian import of ketchup and other tomato sauces by countries of origin in cost terms in 2009-January 2013, ths dollars
32. Volumes of the Russian import of soy sauce by months in physical terms in 2009-January 2013, tons
33. Volumes of the Russian import of soy sauce by months in cost terms in 2009-January 2013, ths dollars
34. Volumes of the Russian import of soy sauce by supplying countries in physical terms in 2009-2012, tons
35. Volumes of the Russian import of soy sauce by supplying countries in cost terms in 2009-January. 2013 , ths tons
36. Largest supplying countries of soy sauce on the Russian market in 2009
37. Largest supplying countries of soy sauce on the Russian market in 2010
38. Largest supplying countries of soy sauce on the Russian market in 2011
39. Largest supplying countries of soy sauce on the Russian market in 2012
40. Volumes of the Russian import of mustard in physical terms by months in 2009- January 2013, tons
41. Volumes of the Russian import of mustard in cost terms by months in 2009-January 2013, ths dollars
42. Volumes of the Russian import of mustard by supplying countries in physical terms in 2009-January 2013, tons
43. Volumes of the Russian import of mustard by supplying countries in cost terms in 2009-January 2013, ths dollars
44. Export volumes of sauces and ingredients for their production by types in physical terms in 2007-January 2013, tons
45. Export structure of sauces and ingredients for their production by types in cost terms in 2007-January 2013, tons
46. Volumes of the Russian export of ready-to-eat sauces and ingredients for their production by countries of destination in 2009- January 2013, tons
47. Volumes of the Russian export of ready-to-eat sauces and ingredients for their production by countries of destination in 2009- January 2013, ths dollars
48. Dynamics of the Russian export of tomato ketchup by months in 2009- January 2013, tons
49. Dynamics of the Russian export of tomato ketchup by months in 2009- January 2013, ths dollars
50. Volume of the Russian export of tomato ketchup by countries of destination in 2009-January 2013, tons
51. Volume of the Russian export of tomato ketchup by countries of destination in 2009-January 2013, ths dollars
52. Dynamics of the Russian export of soy sauce by months in 2009-January 2013, tons
53. Dynamics of the Russian export of soy sauce by months in 2009-January 2013, ths dollars
54. Volumes of the Russian export of soy sauce by countries of destination in 2009-January 2013, tons
55. Volumes of the Russian export of soy sauce by countries of destination in 2009-January 2013, ths dollars
56. Dynamics of the Russian export of mustard by months in 2009-January 2013, tons
57. Dynamics of the Russian export of mustard by months in 2009-January 2013, ths dollars
58. Volumes of the Russian export of mustard by countries of destination in 2007-January 2013, tons
59. Volumes of the Russian export of mustard by countries of destination in 2009-January 2013, ths dollars
60. Average producer prices for mayonnaise in RF in 2010-January 2013, rub/ton
61. Average producer prices for sour cream in RF in 2010-January 2013, rub/ton
62. Average producer prices for sour cream in RF in 2010-January 2013, rub/ton
63. Average producer prices for ready-to-eat mustard in RF in 2012-January 2013, rub/ton
64. Average consumer prices for mayonnaise in RF in 2007- April 2013, rub/kg
65. Average consumer prices for sour cream in RF by months in 2007- April 2013, rub/kg
66. Average consumer prices for ketchup in RF by months in 2007- April 2013, rub/kg
67. The most popular brands of ready-to-eat sauces among Russian consumers in 2005 and 2012, %
68. The most popular brands of mayonnaise and mayonnais e sauces among Russian consumers in 2005 and 2012, %
69. The most popular brands of ketchup and tomato sauces among Russian consumers in 2005 and 2012, %
70. Number of personnel of «Essen production AG» JSC, people
71. Shareholders of «Essen production AG» JSC
72. Production volumes of «Essen production AG» JSC
73. Balance sheet of «Essen production AG» JSC, ths rubles
74. Profit and loss statement of «Essen production AG» JSC, ths rubles
75. Cash flow statement of «Essen production AG» JSC, ths rubles
76. Financials of activity of «Essen production AG» JSC
77. Subsidiaries of «EFKO» JSC
78. Shareholders of «EFKO» JSC
79. Production volumes of «EFKO» JSC
80. Balance sheet of «EFKO» JSC, ths rubles
81. Profit and loss statement of «EFKO» JSC, ths rubles
82. Cash flow statement of «EFKO» JSC, ths rubles
83. Financials of activity of «EFKO» JSC
84. Number of personnel of «NMZHK» JSC, people
85. Subsidiaries of «NMZHK» JSC
86. Shareholders/founders of «NMZHK» JSC
87. Production volumes of «NMZHK» JSC
88. Balance sheet «NMZHK» JSC, ths rubles
89. Profit and loss statement of «NMZHK» JSC, ths rubles
90. Cash flow statement of «NMZHK» JSC, ths rubles
91. Financials of activity of «NMZHK» JSC
92. Subsidiaries of «UNILEVER RUS» LLC
93. Shareholders/founders of «UNILEVER RUS» LLC
94. Production volumes of «UNILEVER RUS» LLC
95. Balance sheet of «UNILEVER RUS» LLC, ths rubles
96. Profit and loss statement of «UNILEVER RUS» LLC, ths rubles
97. Cash flow statement of «UNILEVER RUS» LLC, ths rubles
98. Financials of activity of «UNILEVER RUS» LLC
99. Number of personnel of «Kazanskiy Zhirovoy Kombinat» JSC, people
100. Subsidiaries of «Kazanskiy Zhirovoy Kombinat» JSC
101. Shareholders/founders of «Kazanskiy Zhirovoy Kombinat» JSC
102. Production volumes of «Kazanskiy Zhirovoy Kombinat» JSC
103. Balance sheet of «Kazanskiy Zhirovoy Kombinat» JSC, ths rubles
104. Profit and loss statement of «Kazanskiy Zhirovoy Kombinat» JSC, ths rubles
105. Cash flow statement of «Kazanskiy Zhirovoy Kombinat» JSC, ths rubles
106. Financials of activity of «Kazanskiy Zhirovoy Kombinat» JSC
List of schemes:
1. Classification of mayonnaise by the fat weight fraction
Исследования по теме «Специи, соусы, соль и пищевые добавки»
Обзоры по теме «Пищевая промышленность и продовольствие»
все обзоры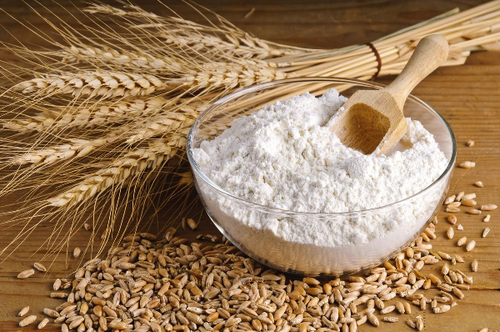
На российском рынке пшеничного крахмала отечественная продукция постепенно вытесняет импорт. Производители модернизируют и расширяют свои заводы, а потребители проявляют все больший интерес к отечественному продукту. Эти процессы влияют на весь рынок: распределение продукции между отраслями, объемы поставок и возможности для экспорта. Компаниям приходится работать в новых условиях и адаптироваться к происходящим изменениям.
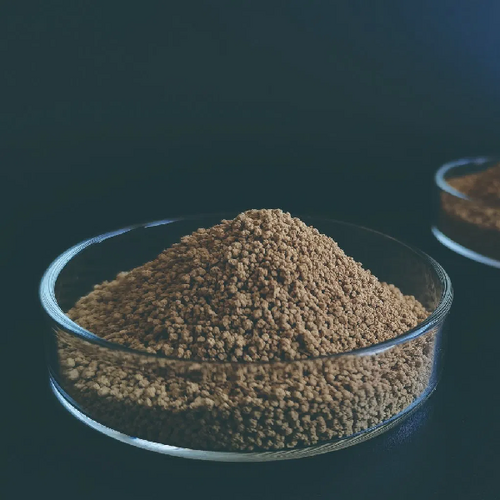
Рынок кормовых аминокислот играет ключевую роль в обеспечении полноценного питания скота, птицы и рыбы, влияя на их рост, продуктивность и здоровье. В настоящее время он в значительной степени зависит от импорта, однако, по оценке наших аналитиков, уже в ближайшие 5–7 лет российское производство не только закрое все внутренние потребности российского рынка, но и обеспечит значительные объемы продукции для экспорта.
Российский рынок крахмальной патоки в последние годы демонстрирует относительную стабильность как по объемам внутреннего производства, так и по экспорту. С одной стороны, это обеспечивается устойчивым уровнем потребления в пищевой и кормовой промышленности, с другой — налаженными поставками в страны СНГ, где продукт пользуется постоянным спросом.


